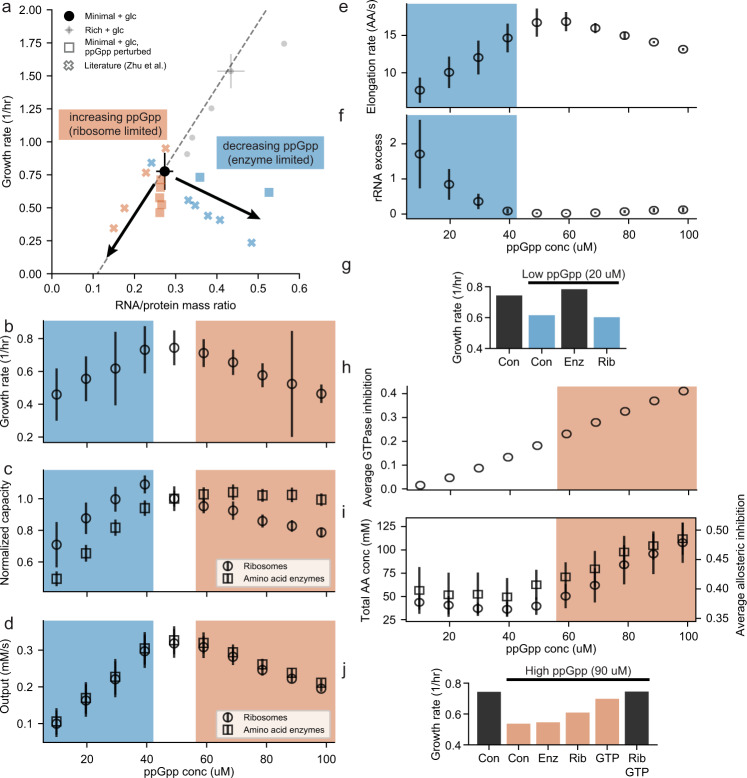
Fig. 3. ppGpp regulation of growth depends on two small molecule feedback inhibition pathways in addition to regulation of gene expression.
a Growth rate vs RNA/protein mass ratio for simulations with perturbed ppGpp concentrations (squares and circles) and literature (crosses and dashed line). Colored points represent minimal glucose media conditions with blue indicating low ppGpp with metabolic enzyme limitations and orange indicating high ppGpp with ribosome limitations. Black arrows indicate the expected trends when ppGpp is perturbed. Average growth rate (b), average capacity of ribosomes (circles) or amino acid enzymes (squares) normalized to wildtype capacity (c), average total output rates from ribosomes (circles) and amino acid enzymes (squares) (d), average elongation rate per ribosome (e), and average fraction of ribosome mass that is excess rRNA mass and not included in ribosomes (f) from simulations at various concentrations of ppGpp. Blue boxes indicate ppGpp concentrations leading to enzyme limitations while orange boxes represent ppGpp concentrations leading ot ribosome limitations. g Average growth rate from simulations at wildtype ppGpp concentrations, low ppGpp concentrations, and low ppGpp concentration with expression modifications (con: control, enz: increased enzyme expression, rib: increased ribosome expression). Average GTPase inhibition by ppGpp (h) and total amino acid concentrations (left, circles) leading to an average amino acid pathway allosteric inhibition (right, squares) (i) from simulations at various concentrations of ppGpp. j Average growth rate from simulations at wildtype ppGpp concentrations, high ppGpp concentrations, and high ppGpp concentration with expression and/or GTPase modifications (con: control, enz: increased enzyme expression, rib: increased ribosome expression, GTP: remove inhibition of GTPases). Simulation data comes from 6 generations and 8 initial seeds (4 initial seeds for g and j) and error bars represent standard deviation.

