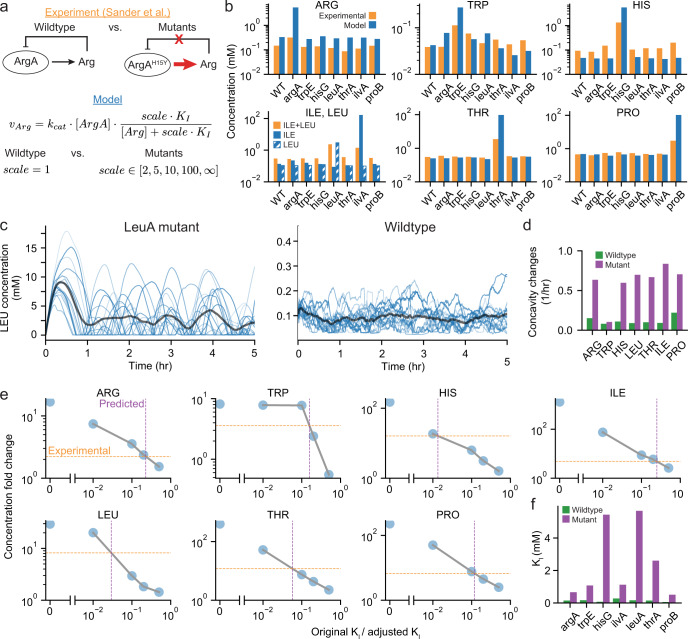
Fig. 4. Simulations with amino acid allosteric inhibition removed provide amino acid concentration predictions that are comparable to experimental results.
a Schematic showing the effect of mutants experimentally, where point mutations remove allosteric inhibition of the amino acid end-product on a pathway enzyme leading to higher amino acid concentrations, and in the model, where the mutation is represented as a scaling factor that increases the end-product inhibitory concentration (KI) that increases the rate of amino acid production. b Amino acid concentrations in wild-type cells and mutants with allosteric inhibition removed from experiments (orange, Sander et al.35) and the model with scale = infinity (blue). Note that isoleucine and leucine cannot be distinguished experimentally but have distinct concentrations in the model (solid: isoleucine, hatched: leucine). See Supplementary Table 4 for the standard deviation for simulations. c Time series for leucine concentrations for LeuA mutant without allosteric inhibition showing oscillatory concentrations without the fast feedback of enzyme inhibition compared to the wildtype with allosteric inhibition. Blue traces show individual cell lineages and the average is shown in gray. d Average frequency of concavity changes for each amino acid concentration from wildtype simulations and the mutant simulations corresponding to the amino acid. This is a proxy for 1/period if the fluctuations were regular and periodic. e Predictions of the extent of inhibition removal based on the concentration fold changes in experiments compared to simulation fold changes. f Allosteric feedback inhibition constants for each enzyme for reported wildtype value (green) and effective KI in mutants based on analysis in (d) (purple). Simulation data comes from 16 generations and 16 initial seeds for (b), (c), and (d) and 8 generations and 4 initial seeds for (e) and (f).

