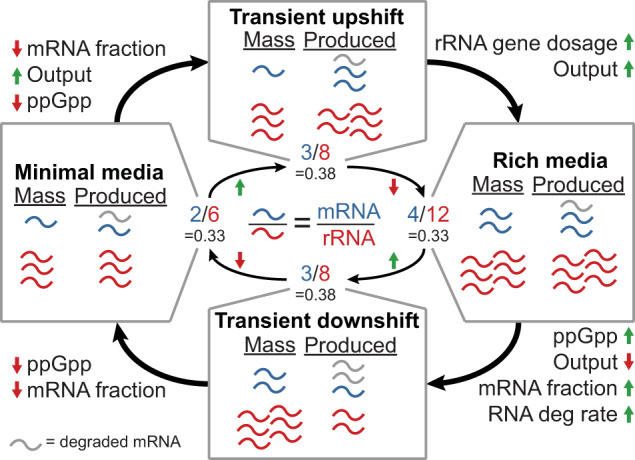
Fig. 6. Transient increases in the mRNA to rRNA ratio arise through different mechanisms during nutrient up- or downshifts.

Schematic demonstrating a toy example of how an increase or decrease in ppGpp concentration can lead to similar increases in the mRNA to rRNA ratio. “Mass'' represents the amount of RNA (blue: mRNA, red: rRNA, gray: degraded mRNA) that would already be present at the start of a cell cycle and “Produced'' represents the number that will be produced throughout a cell cycle. Note that in minimal or rich media there is balanced growth with mRNA and rRNA both doubling; however, during transient shifts, these amounts need not be balanced. Text in the outer corners describes significant changes when shifting from one box to another based on simulation observations. In the center, the mRNA to rRNA ratio is shown for each condition with the transient shift conditions both showing higher ratios than the steady state minimal or rich media.
