
Fig. 5.
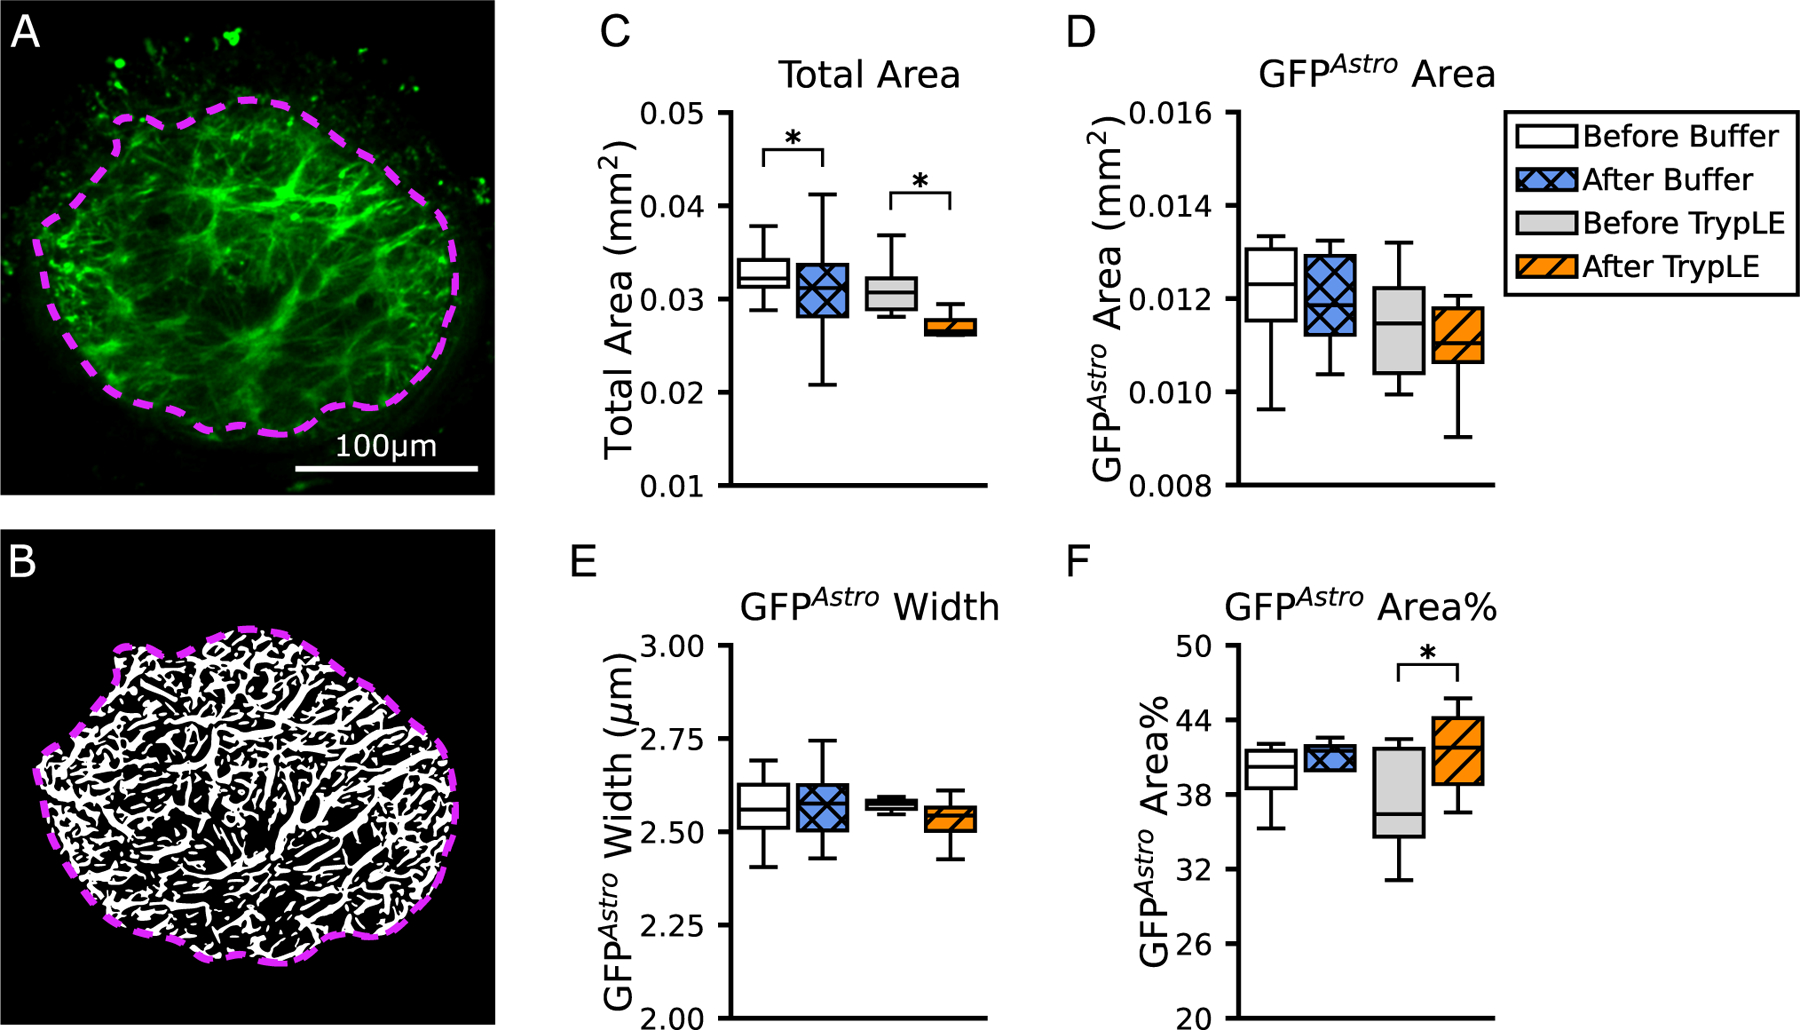
Characterization of the processes expressing GFPAstro in the AL. Numerical values are in Table 3. (A) One representative z-slice from a slow scan taken before the treatment with buffer. Green is the TPF of the GFPAstro image. The image was enhanced and processed by the network analysis algorithm in order to detect processes, shown in white in the (B) binarized image. The total AL area is marked by the violet dashed line. (C) Boxplots of the total AL area show that it was smaller after treatment with buffer (p = 0.03) and even more dramatically after treatment with TrypLE (p = 0.0001). (D) Boxplots of the area of GFPAstro processes, (E) the GFPAstro process width, and (F) the GFPAstro Area%. Statistical significance is from Wilcoxon signed rank tests, with ∗p<0.05 (n = 8 per group). Scale Bar=100 μm.