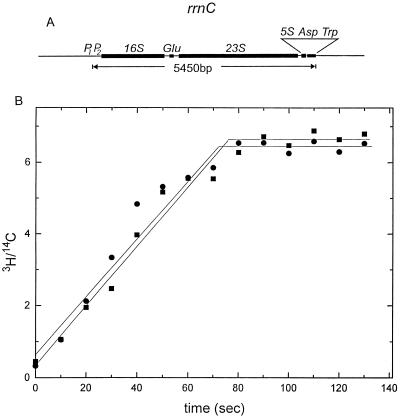
FIG. 6.
(A) Schematic of the rrnC operon. Note the unique tRNATrp gene at the 3′ end of the operon. (B) Transcription elongation rates of the rrnC operons in the strains containing either pNO1301 (circles) or pBR322 (squares). Although the steady-state level of tRNATrp in the strain containing pNO1301 was about 30% lower than that in the strain containing pBR322, the plateaus are at the same value in this plot because both the 3H and 14C values are measurements of the tRNATrp levels; the 3H/14C corrected value cancels out the difference between the two strains. The uncorrected plots for 3H and for 14C both showed a 0.7-fold difference in the level of tRNATrp (data not shown), suggesting that rRNA stability did not differ between the two strains.

