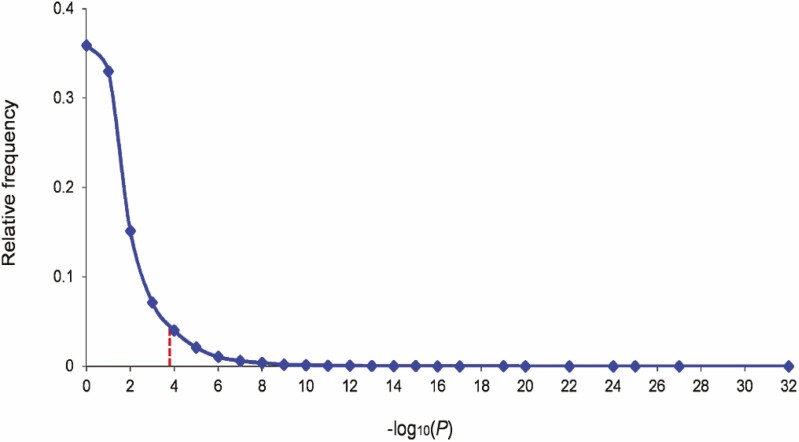
Figure 2.
Expression-based genome-wide association study (eGWAS) analysis in type 1 diabetes (T1D) pancreatic islets. The relative frequency distribution of –log10 (combined P value). The combined P values for each gene were calculated from 169 T1D case-control microarray samples (78 T1D cases and 91 controls) using a weighted Z method. There were 16 099 genes in total. The –log10 (combined P values) were rounded to the nearest integer, and then the relative frequency distribution was determined. The red line indicates the Q value threshold (Q value < 0.001; P value < 1.6 × 10⁻⁴).

