Figure 10.

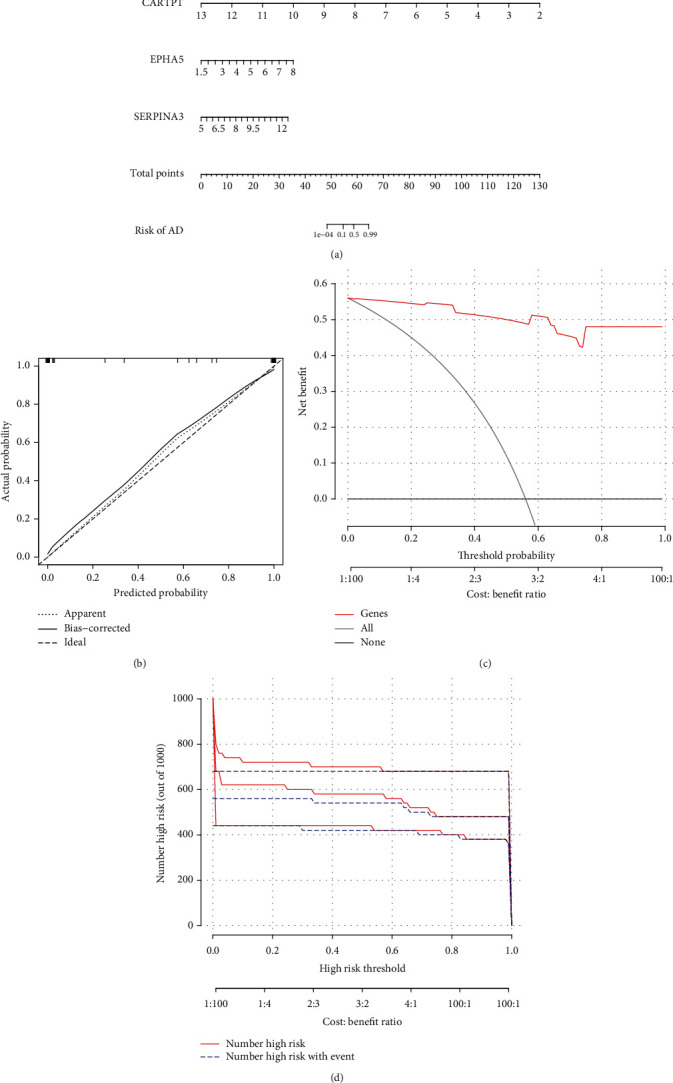
The nomogram model based on the gene expression in GSE122063 (AD). (a) The nomogram, (b) the calibration curve, (c) the DCA curve, and (d) the clinical impact curve.

The nomogram model based on the gene expression in GSE122063 (AD). (a) The nomogram, (b) the calibration curve, (c) the DCA curve, and (d) the clinical impact curve.