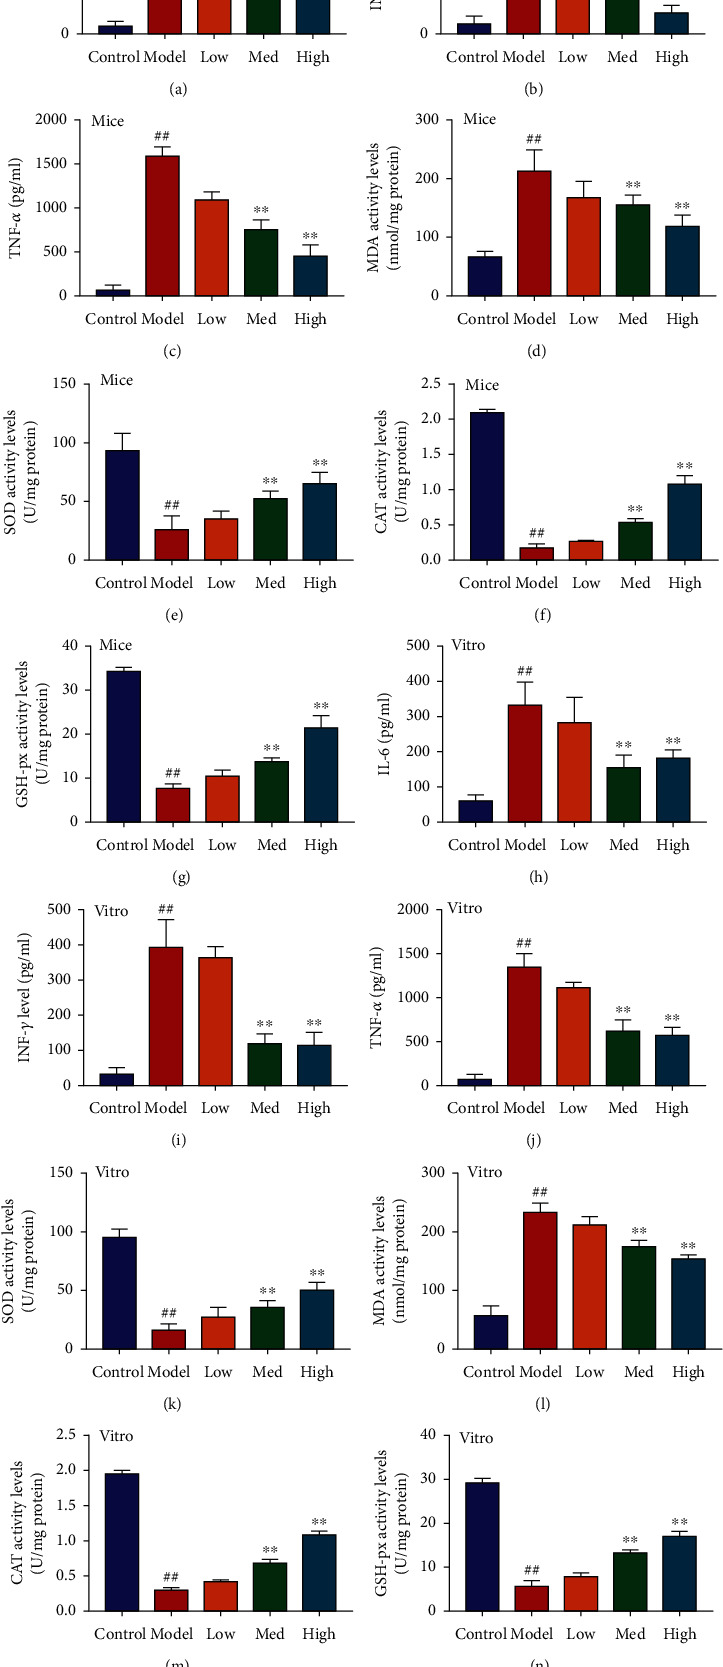
Figure 3.

Schisandrin A reduced oxidative stress and inflammation in model of DN. (a, b, and c) IL-6, INF-γ, and TNF-α; (d, e, f, and g) MDA, SOD, CAT, and GHS levels in mice of DN; (h, i, and j) IL-6, INF-γ, and TNF-α; and (k, l, m, and n) MDA, SOD, CAT, and GHS levels in vitro model of DN. Control, sham control mice group; model, STZ-induced mice DN group; low, mice DN by treatment with 25 mg/kg of Schisandrin A group; med, mice DN by treatment with 50 mg/kg of Schisandrin A group; high, mice DN by treatment with 100 mg/kg of Schisandrin A group; control, control group; model, in vitro model group; low, in vitro model by 25 μM of Schisandrin A group; med, in vitro model by 50 μM of Schisandrin A group; high, in vitro model by 100 μM of Schisandrin A group; ##P < 0.01 versus control group; ∗∗P < 0.01 versus STZ-induced mice DN group or in vitro model group.
