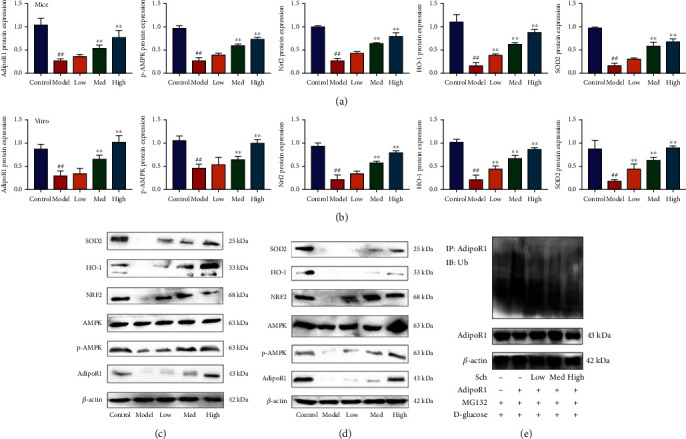
Figure 7.

Schisandrin A induced AdipoR1 protein and suppressed AdipoR1 ubiquitination. (a and c) AdipoR1, p-AMPK, Nrf2, HO-1, and SOD2 protein expression in mice model; (b and d) AdipoR1, p-AMPK, Nrf2, HO-1, and SOD2 protein expression in vitro model; and AdipoR1 ubiquitination in vitro model (e). Control, sham control mice group; model, STZ-induced mice DN group; low/med/high, mice DN by treatment with 25/50/100 mg/kg of Schisandrin A group; ##P < 0.01 versus control group; ∗∗P < 0.01 versus STZ-induced mice DN group. Control, sham control mice group; model, in vitro model of DN group; low/med/high, in vitro model of DN by treatment with 25/50/100 μM of Schisandrin A group; ##P < 0.01 versus control group; ∗∗P < 0.01 versus in vitro model group.
