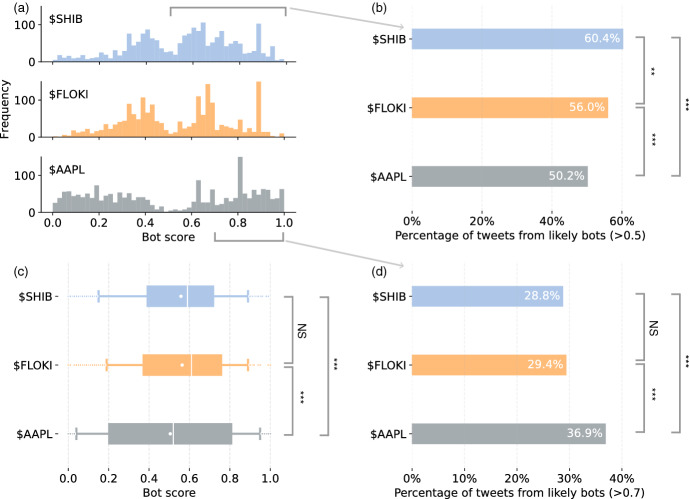
Fig. 3.
a Bot score distributions for tweets mentioning different cashtags. b Percentage of tweets posted by likely bots using 0.5 as a threshold. c Box plots of the bot scores for tweets mentioning different cashtags. The white lines indicate the median values; the white dots indicate the mean values. d Similar to b but using a bot score threshold of 0.7. Statistical tests are performed for pairs of results in b–d. Significance level is represented by the stars: ***, **, *, NS

