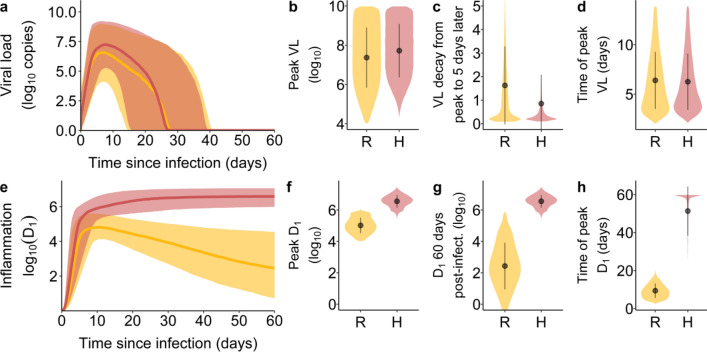
Figure 3.
Viral load and inflammation trajectory characteristics by inflammation trajectory groups. (a) Viral loads over the course of infection. The shaded area corresponds to the 10th and 90th percentiles of the viral loads, while the curve represents the median. (b) The distribution of peak viral loads, (c) the VL decay from peak infection to 5 days after peak infection and (d) the time of occurrence of peak VL after infection. (e) Inflammation trajectories by inflammation trajectory groups. The shaded area corresponds to the 10th and 90th percentiles of , while the curve represents the median. (f) the distribution of peak , (g) the distribution of at 60 days post-infection and (h) the time of occurrence of peak after infection. In orange and represented by the symbol R, Resolved inflammation. In pink and represented by the symbol H, Hyperinflammation.

