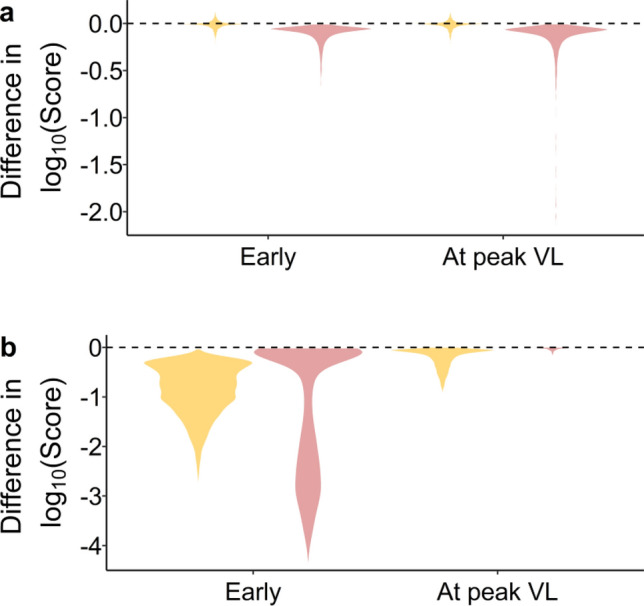
Figure 6.

Violin plots of the effect of virtual treatment on the Disease Score. (a) represents administration of corticosteroids while (b) represents antiviral drug administration. Negative values represent improvements while positive values represent the worsening of symptoms. Note there were no clear difference between a reduction in or in the simulation of antivirals so the figure applies to both cases. Orange denotes the effect of treatment among individuals who would have resolved inflammation in the absence of treatment, whereas pink denotes the effect of treatment among individuals who would have had hyperinflammation in the absence of treatment.
