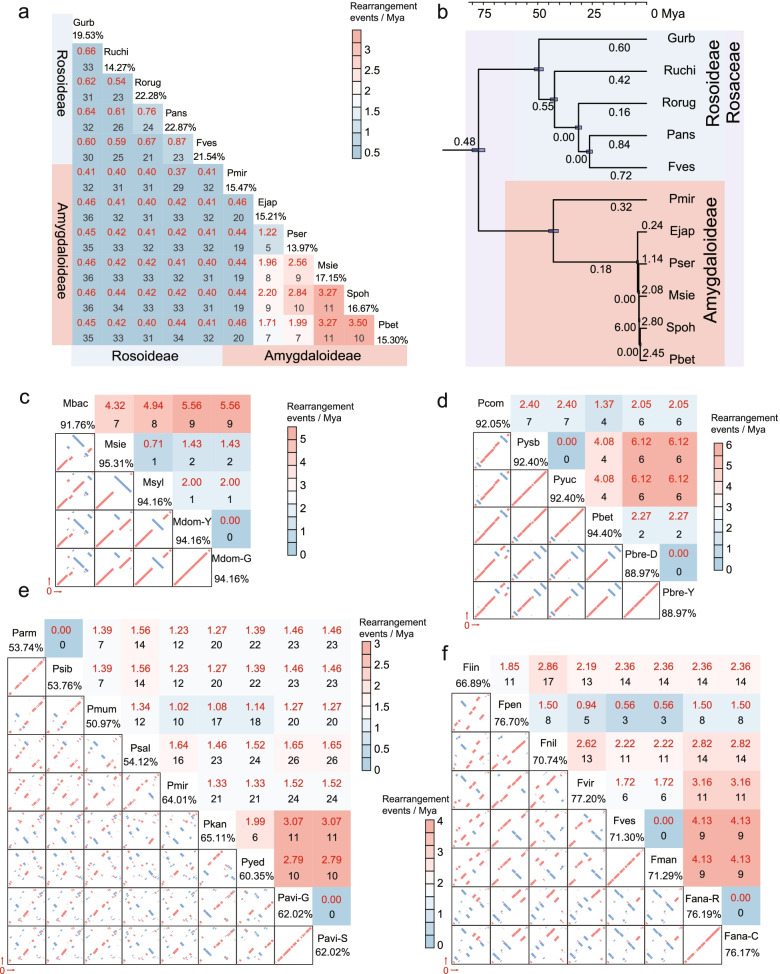
Fig. 3.
Rearrangement event and rate analysis. a Number and rate of pair-wise rearrangement events between eleven genera. Black numbers represent the rearrangement events (pair-wise rearrangement events), and red numbers represent the pair-wise rearrangement rates. b Rearrangement rates in eleven genera. The numbers of rearrangement events per million years are displayed on branches of the phylogeny. c–f The pair-wise analysis of rearrangement events and rate within Malus (c), Pyrus (d), Prunus (e), and Fragaria (f). Upper-right heatmaps represent the pair-wise rearrangement rates. Red numbers represent the rearrangement rates, and black numbers represent the rearrangement events. Bottom-left figures display the synteny analysis between two samples. Red represents direct, and blue represents inverted. Numbers under the sample ID represent the percent of shared sequences

