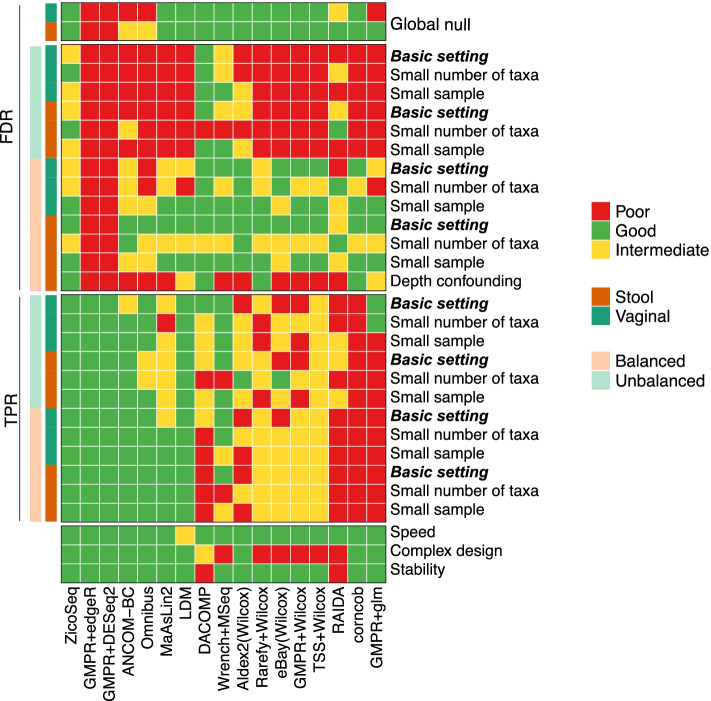
Fig. 6.
Performance summary of differential abundance analysis methods based on various evaluation metrics. The first and second parts include metrics for false-positive control (false discovery rate, FDR) and power (true positive rate, TPR), respectively. The third part consists of general metrics related to the usability of the method. For each metric, the performance is categorized into “poor,” “good,” and “intermediate” (Table S3). “Basic setting,” “small number of taxa,” and “small sample” refer to the setting with 100 samples and 500 taxa, 100 samples and 50 taxa, and 50 samples and 500 taxa, respectively

