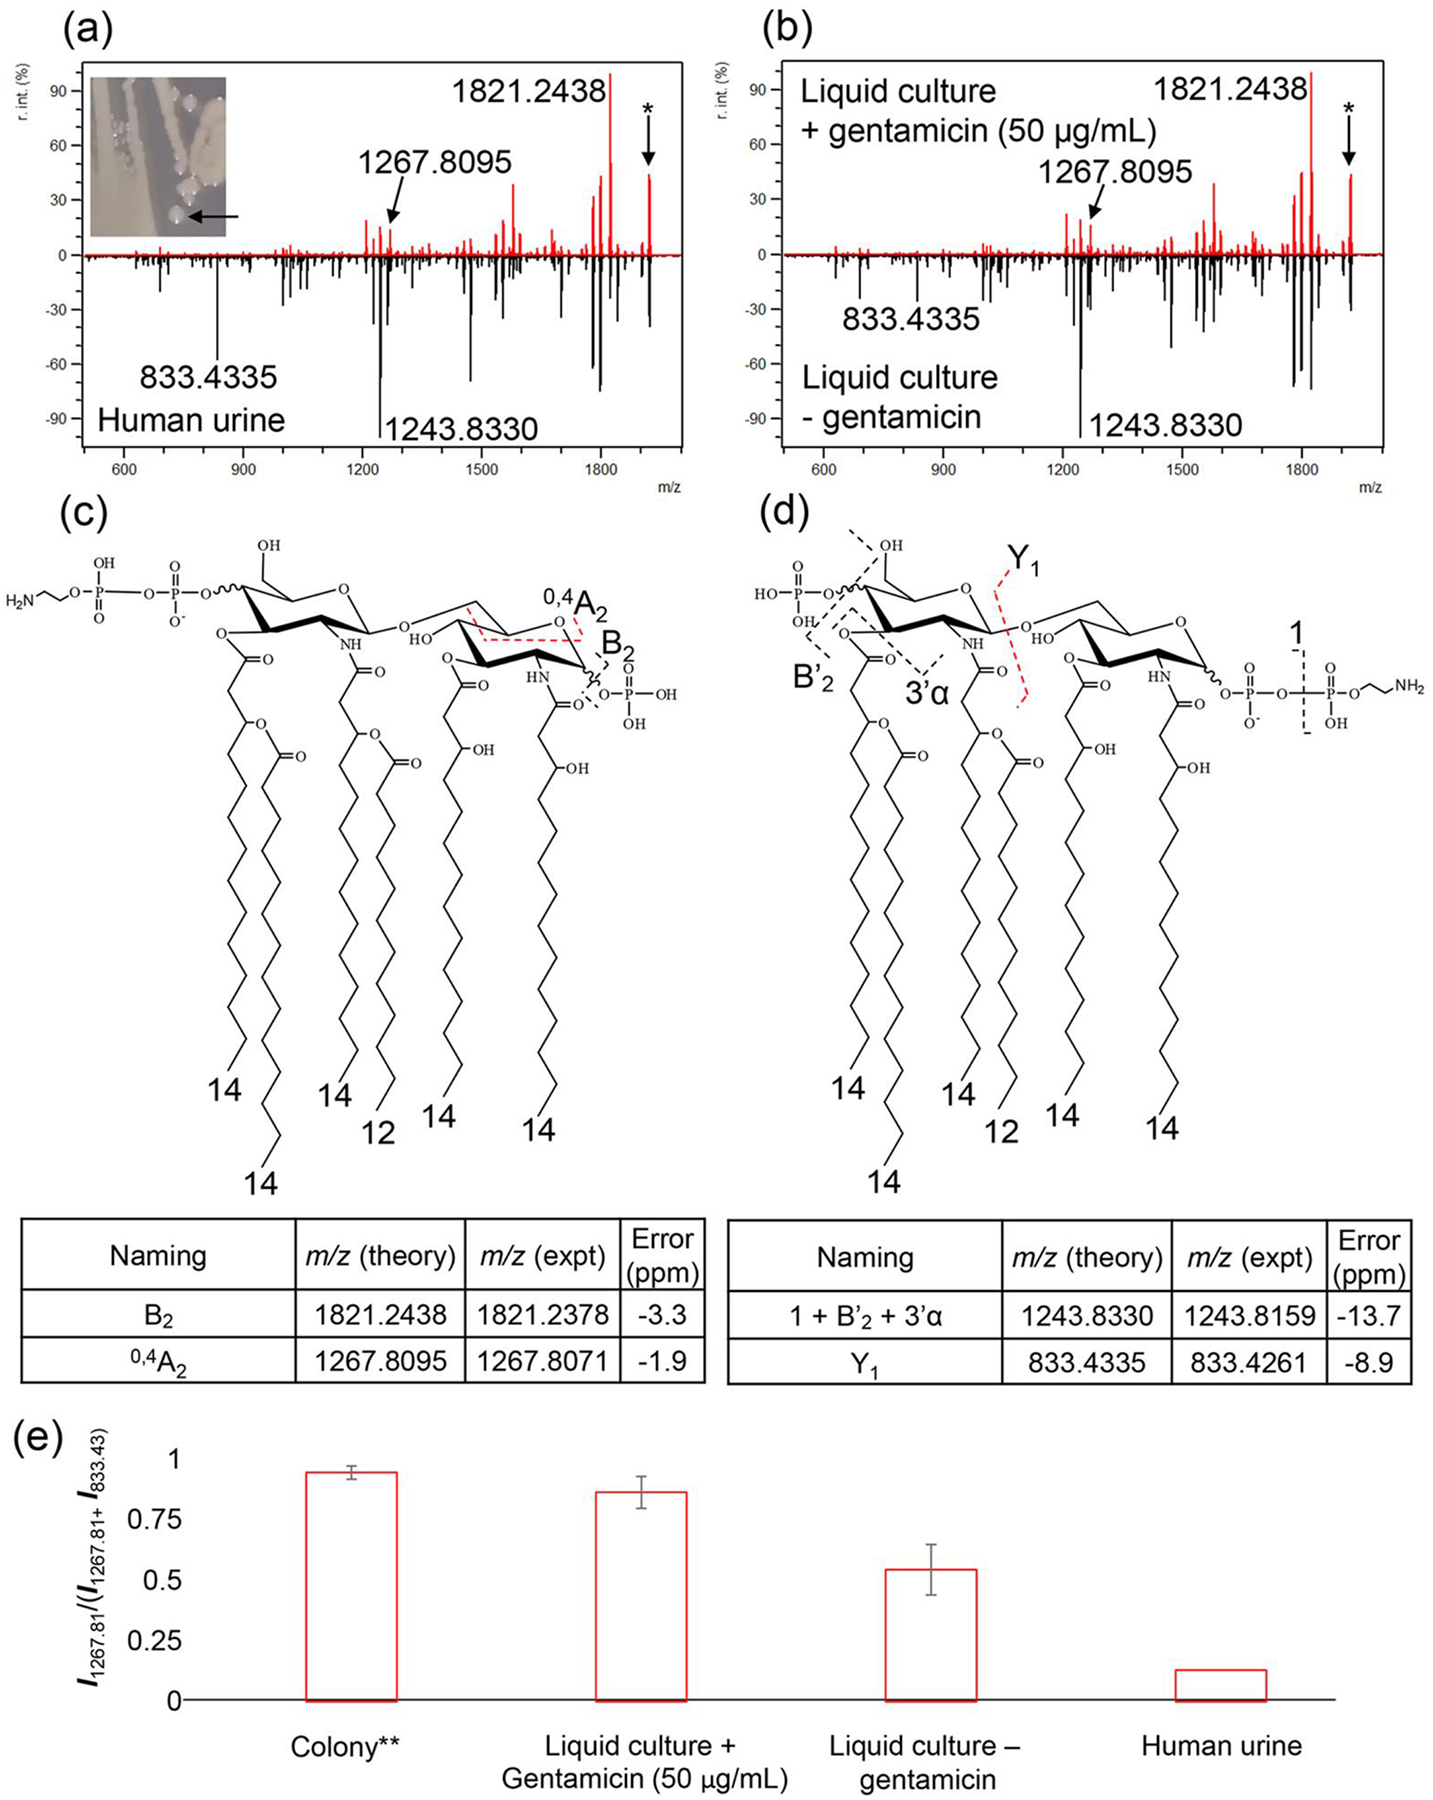
Figure 2.

FLATn mass spectra of m/z 1919.2206, where the samples were obtained from (a) Single colony (Top) and human urine sample (Bottom), (b) liquid culture with gentamicin (50 μg/mL, Top) and without gentamicin (Bottom). Asterisk mark (*) in the mass spectra indicates precursor ion at m/z 1919.2206. The structure of 4’ (c) and 1-phosphate group (d) modification with PEtN (e) a bar graph of ratio of intensities of two ions between 1267.8095 and 833.4335, which represents 4’- and 1-phosphate group modification by PEtN addition, respectively. **Agar plate with gentamicin (50 μg/mL)
