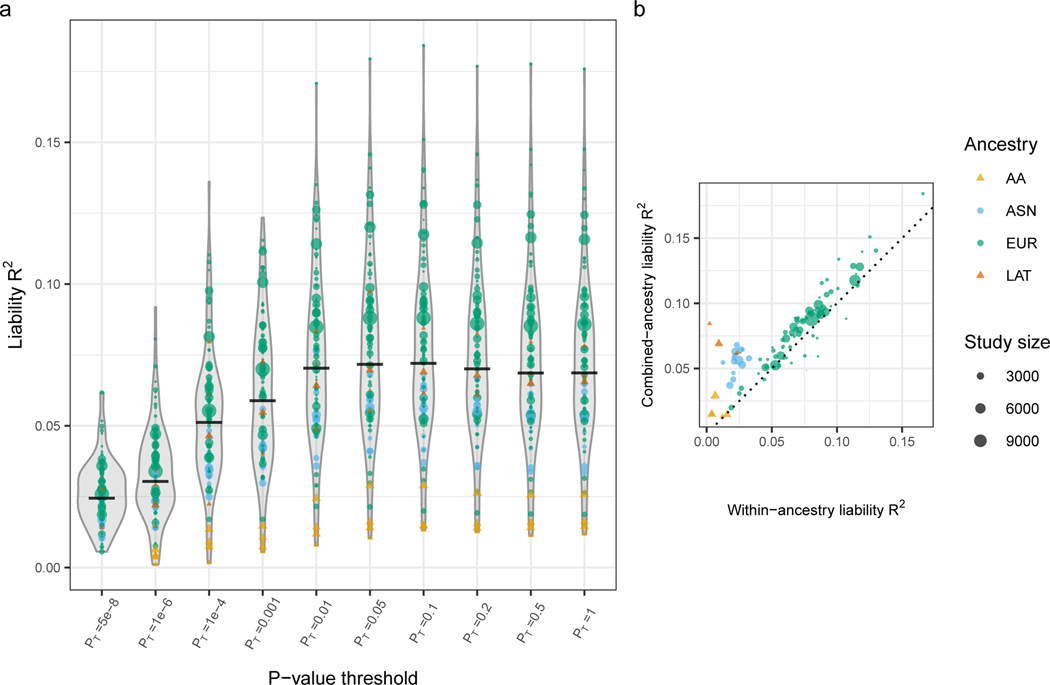
Extended Data Figure 2: Polygenic risk prediction.
A) Distributions of liability scale R2 across 98 left-out-cohorts for polygenic risk scores built from SNPs with different p-value thresholds. Distributions of liability R2 (assuming schizophrenia life-time risk of 1%) are shown for each p-value threshold, with point size representing size of the left-out cohort and colour representing ancestry. The median liability R2 is represented as a horizontal black line. B) Liability R2 of predicted and observed phenotypes in left-out cohorts using variants with p-value threshold p=0.05, from the fixed effect meta-analysis of variant effects, unadjusted for multiple comparisons. The polygenic risk scores are derived from two separate sets of leave-one-out GWAS meta-analyses: y-axis R2 based on the results of primary GWAS including all ancestries; x axis R2 based on cohorts of the same ancestry as the test samples. Circles denote core PGC samples. Triangles denote African American and Latino samples processed external to PGC by the providing author.

