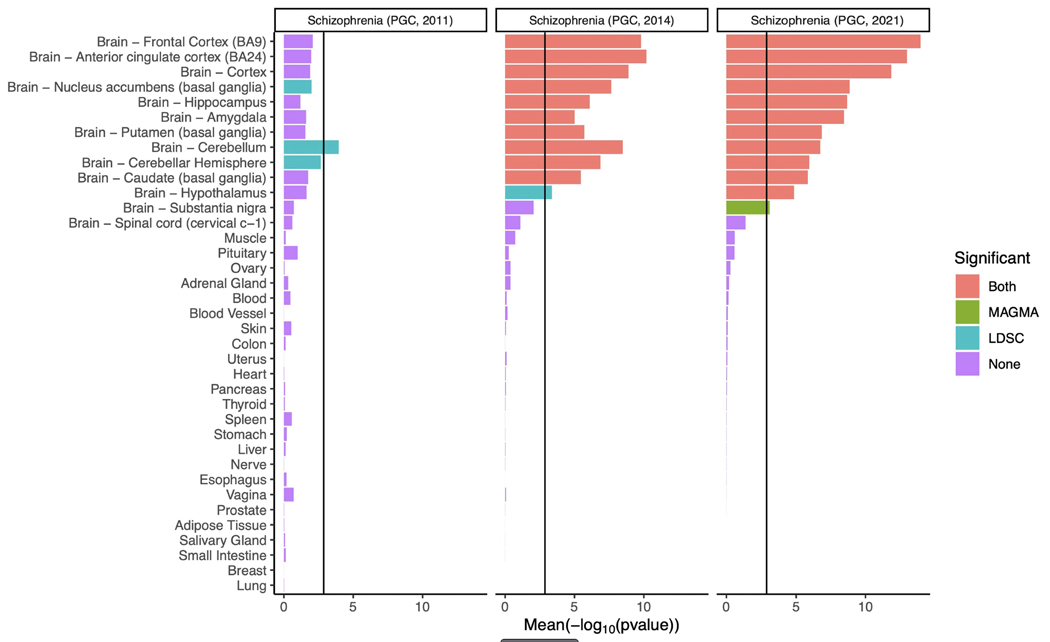
Extended Data Figure 3: Association between 37 human tissues and schizophrenia.
The mean of the evidence (-log10P) obtained from two methods (MAGMA, LDSC) for testing GWAS data for enrichment of association in genes with high expression in each tissue as determined from bulk RNA-seq20. The bar colour indicates whether gene expression in the tissue is significantly associated with both methods, one method or none. The black vertical line represents the significance threshold corrected for the total number of tissues tested in this experiment. We also analysed previous waves of PGC schizophrenia GWAS11,21 for comparison.

