
Figure 1.
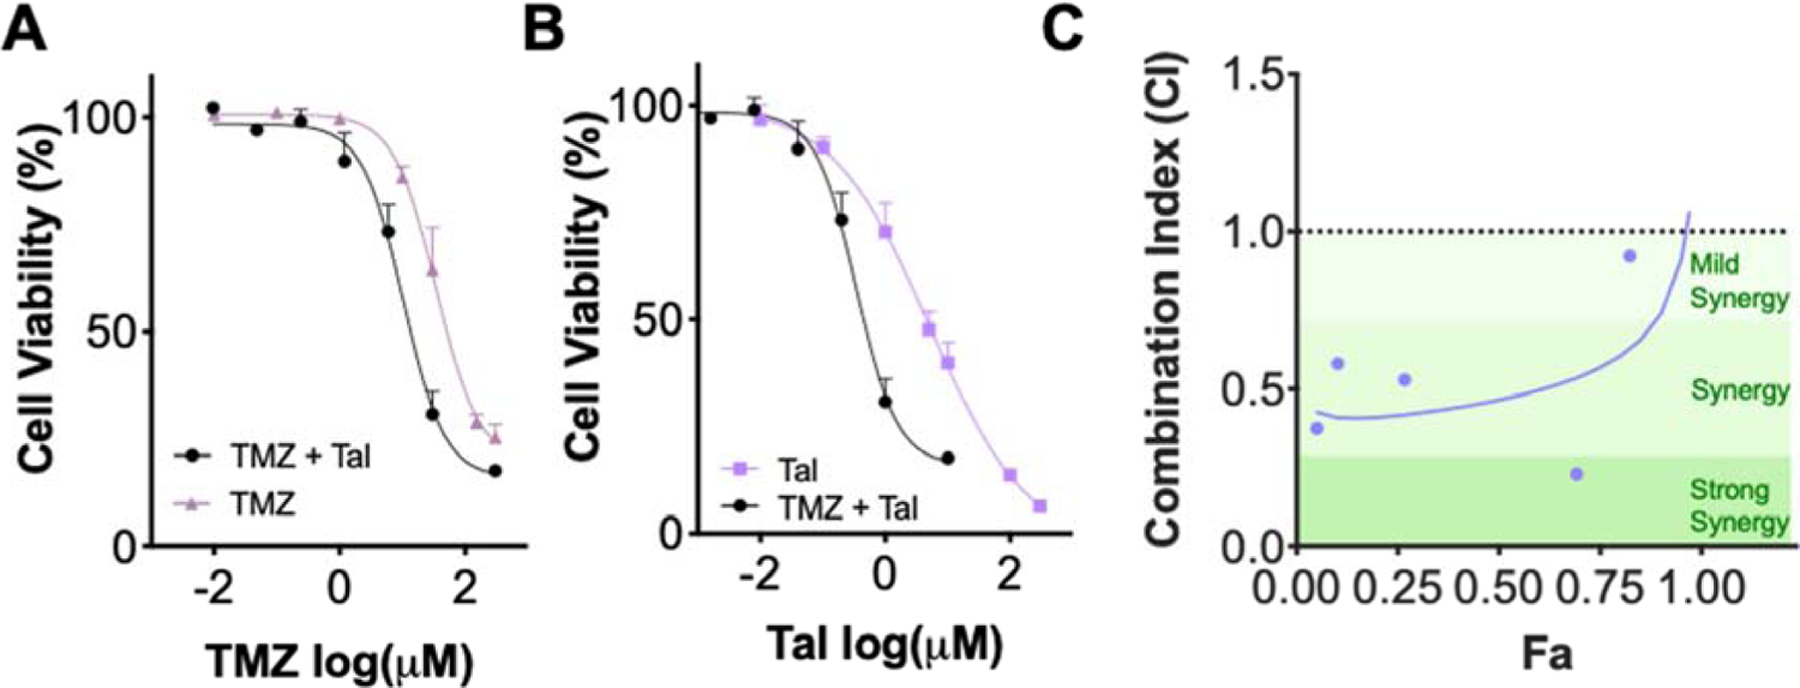
A. Cell viability curves of TMZ and TMZ:Tal at a 30:1 ratio graphed against TMZ concentration. B. Cell viability curves of Tal and TMZ:Tal at a 30:1 ratio graphed against Tal concentration C. Combination Index plot demonstrating synergy for various combinations of TMZ:Tal (30:1) utilizing Fa values between 0.1 and 0.9 from A and B.