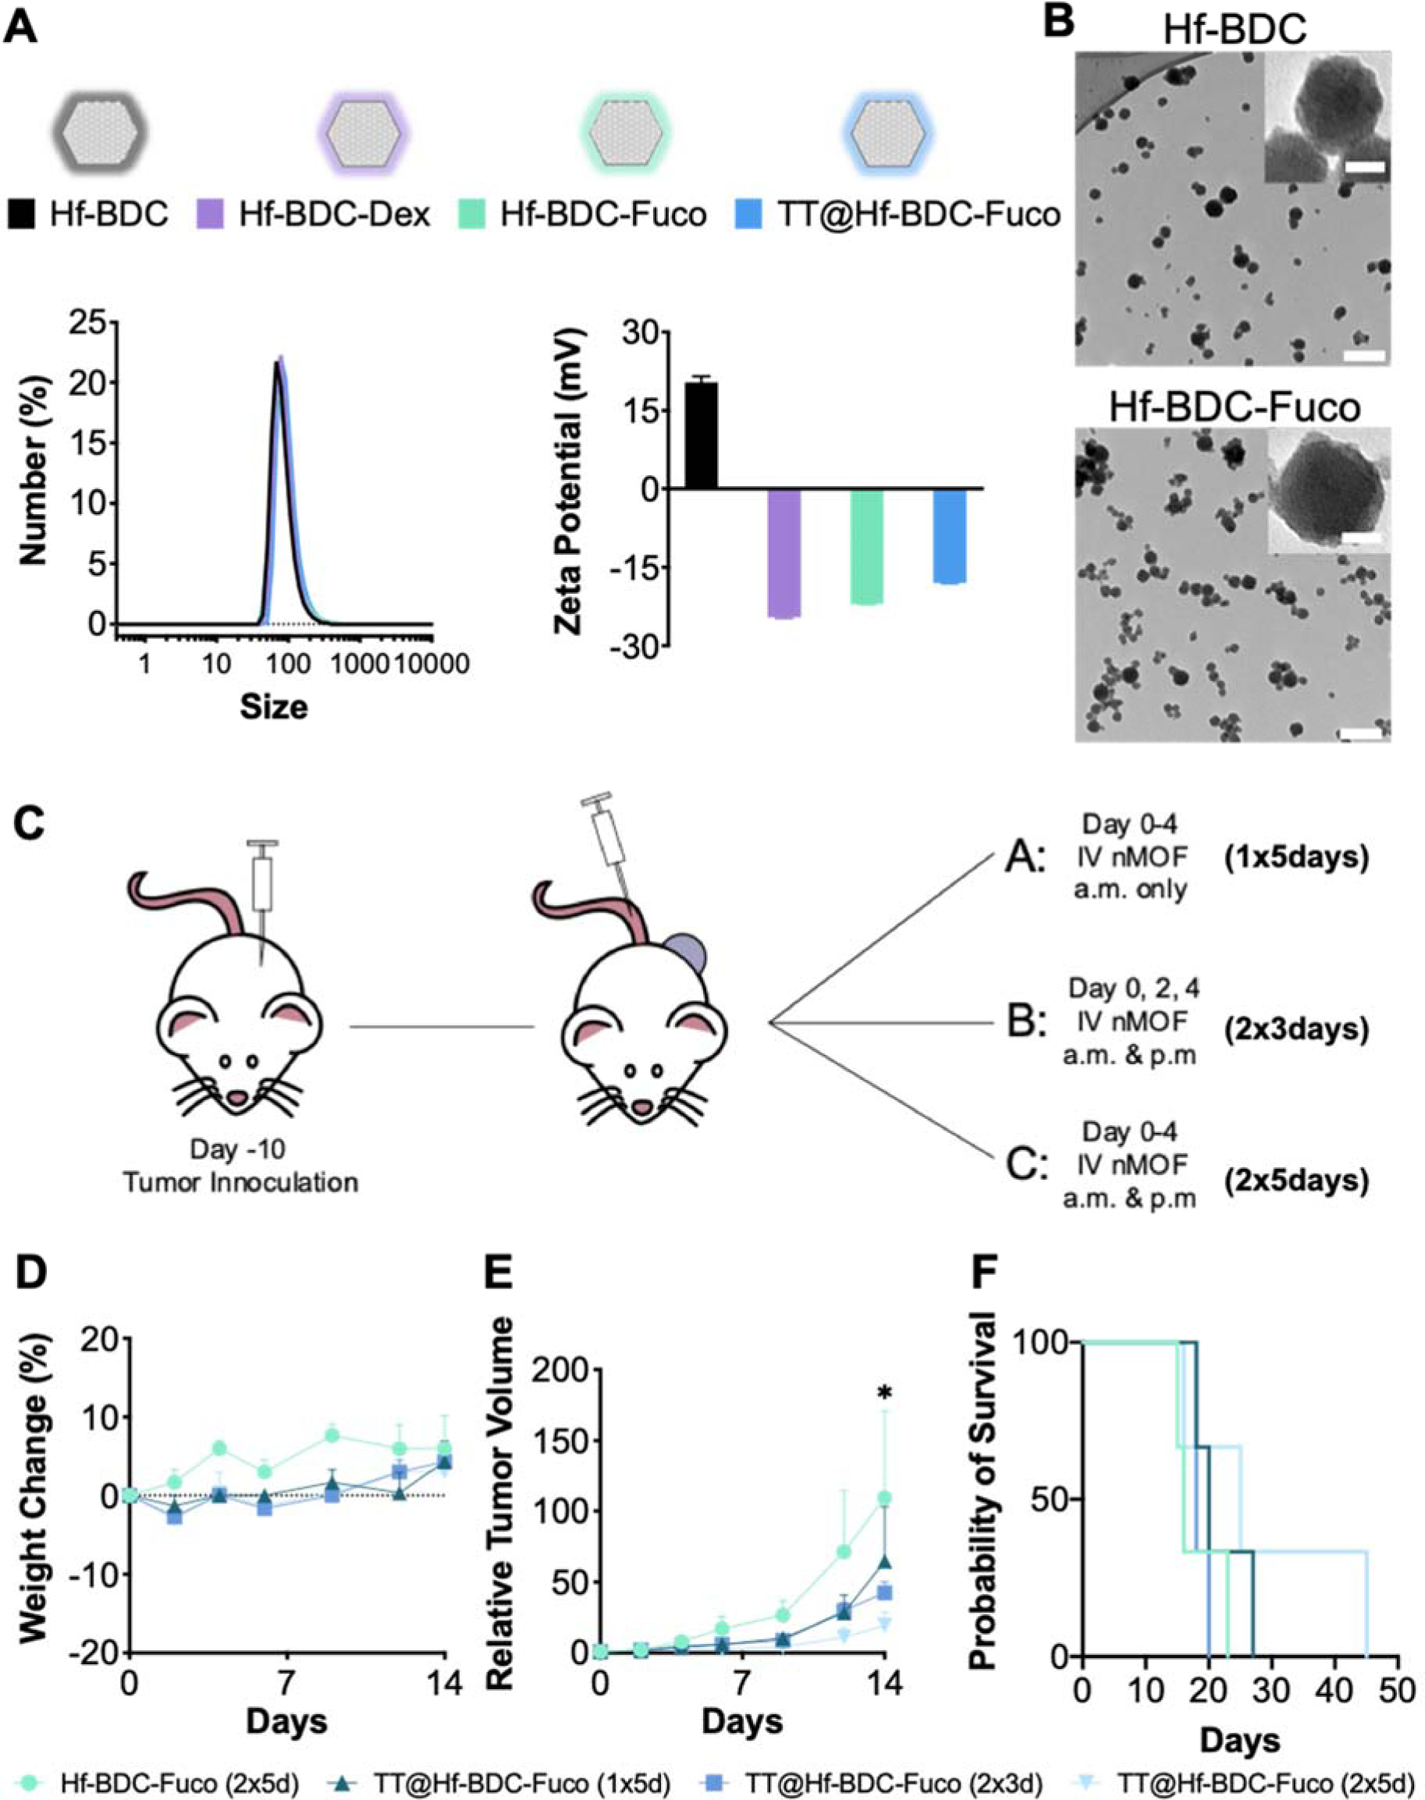
Figure 2.

A. Representative nanopartide coatings symbols utilized throughout study (top). ζ potential (bottom left) and size by number (bottom right) measurements for the various nMOF coatings and drug loading B. TEM image of Hf=BDC (top) and Hf-BDC-Fuco (bottom). Scale bar represents 200 nm in the main image and 20 nm in the inset image. In vivo pilot study to determine optimal nMOF dosing regimen before incorporating radiation. C. Schematic representation of the three treatment schedules utilized for proof of concept study. D. Weight measurements over course of injections to evaluate treatment tolerability. E. Tumor growth curves for mice treated with various dosing schemes. F. Kaplan-Meier survival curve to evaluate treatment efficacy. Asterisk (*) represent statistically significant difference (p<0.05) between the control (Hf-BDC-Fuco) and the 2×3 and 2×5 day treatment regimens analyzed by two-way ANOVA.
