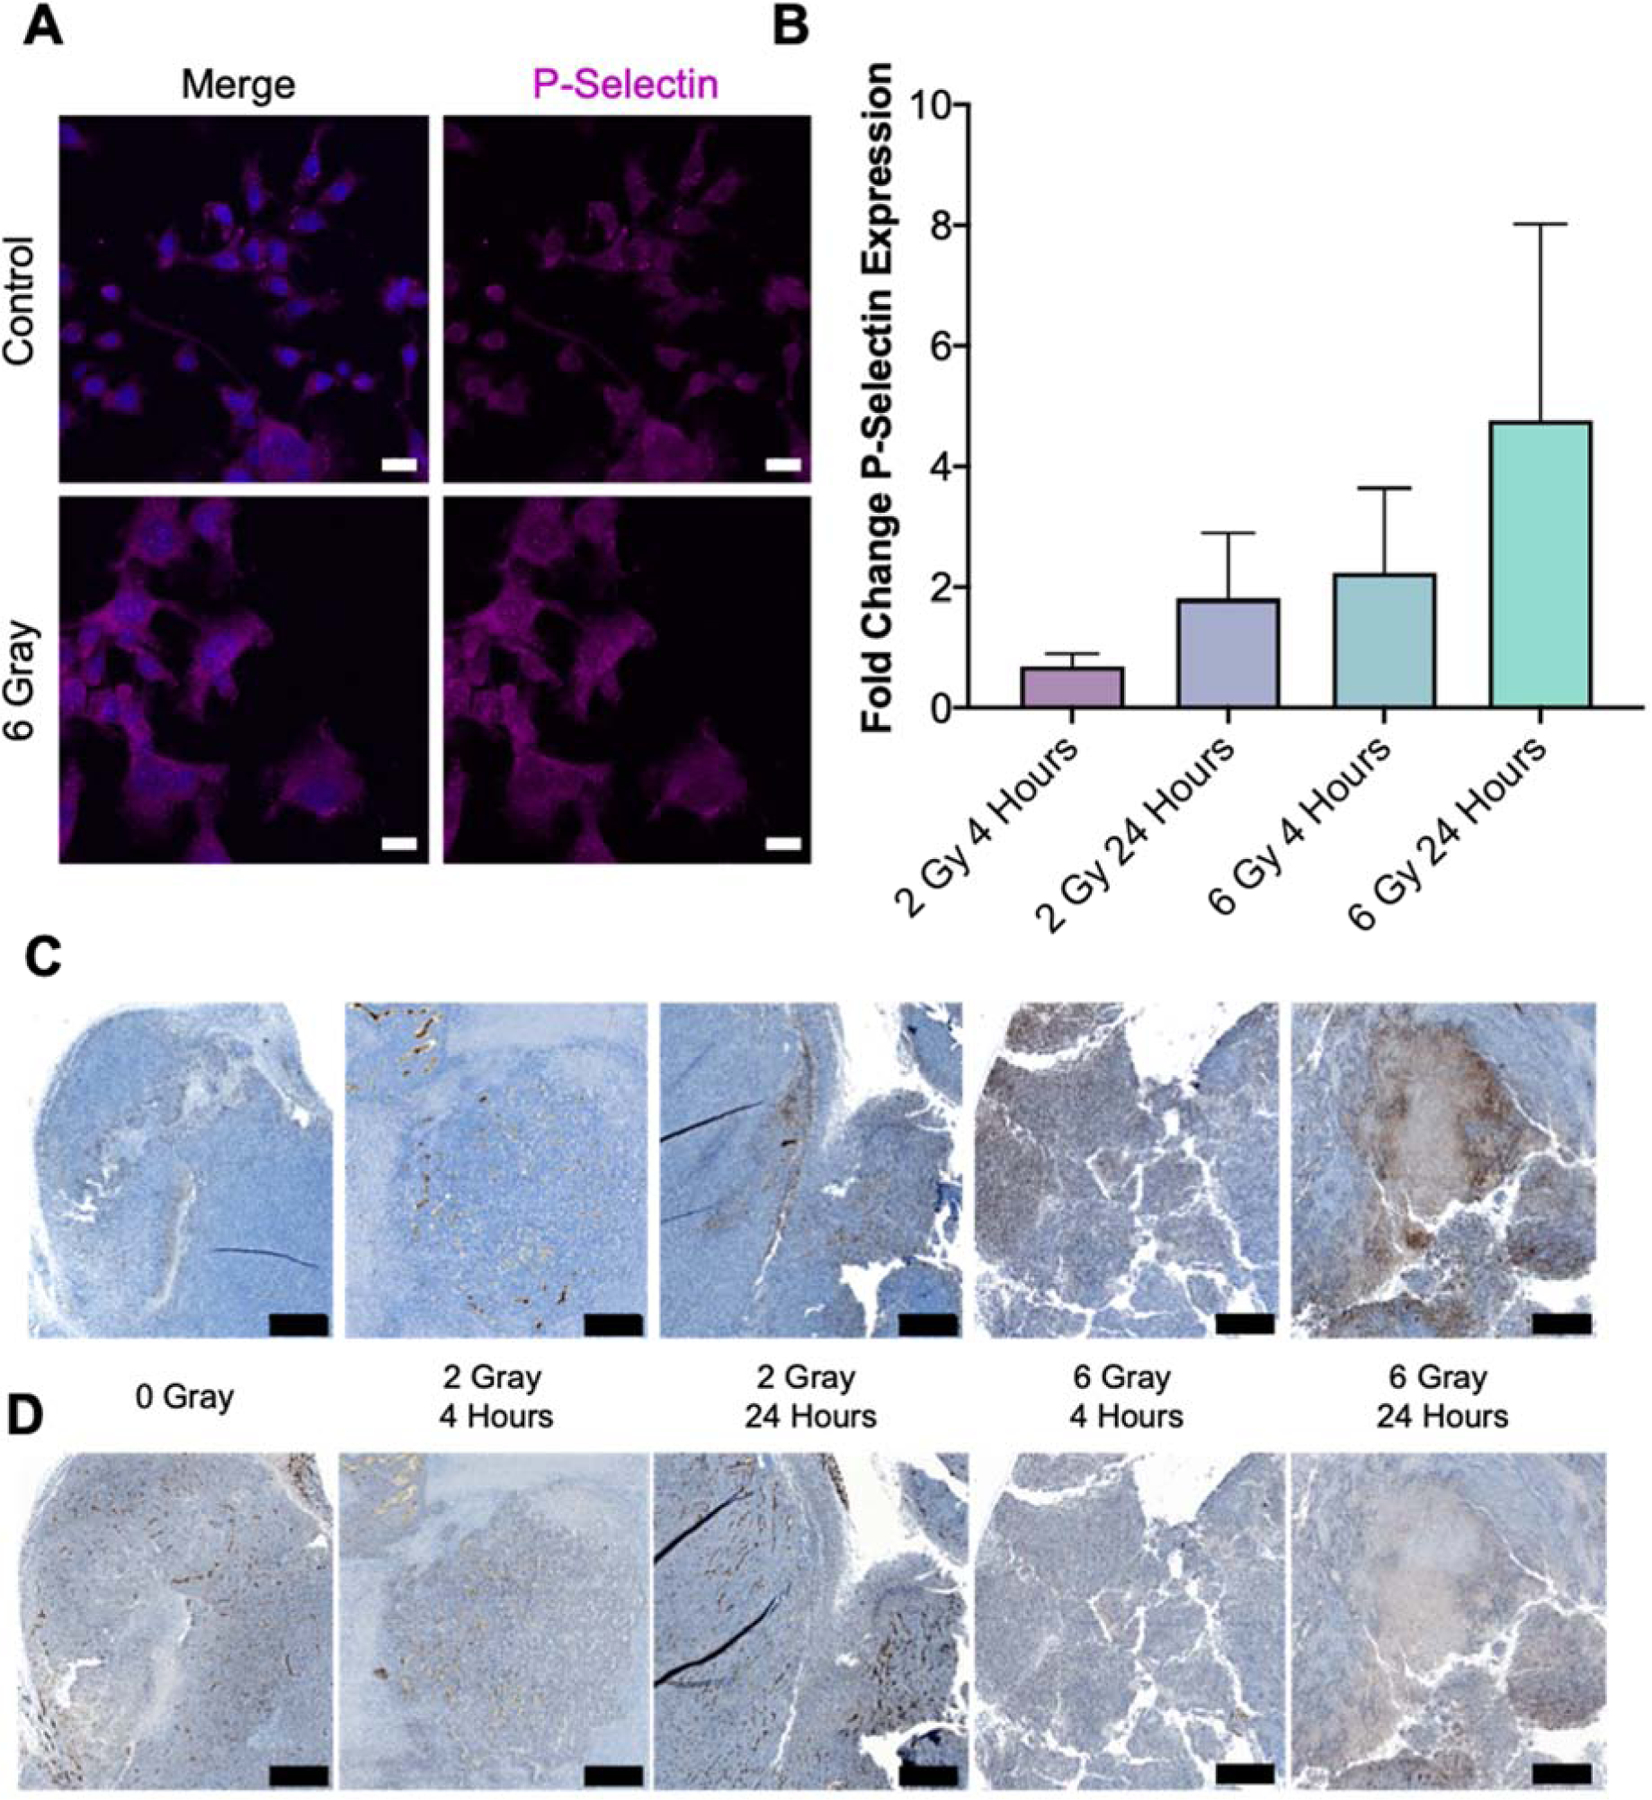
Figure 3.

A. P-selectin (pink) expression of DAPI (blue) stained CT26.wt cells before and after radiation demonstrate a decrease in puncta and increase in overal cytoplasmic expression after a radiation dose of 6 gray. Scale bars represent 20 μm. B. Quantification of fold-change in P-selectin expression as a fraction of total tissue for various treatments when compared to no radiation demonstrate in increase in P-selectin expression with respect to IR dose and time after IR. C. Representative sections of tissues analyzed for B zoomed to highlight maximal P-selectm staining (brown). D. Corresponding CD31 stained sections to images in C. Scale bars represent 500 μm.
