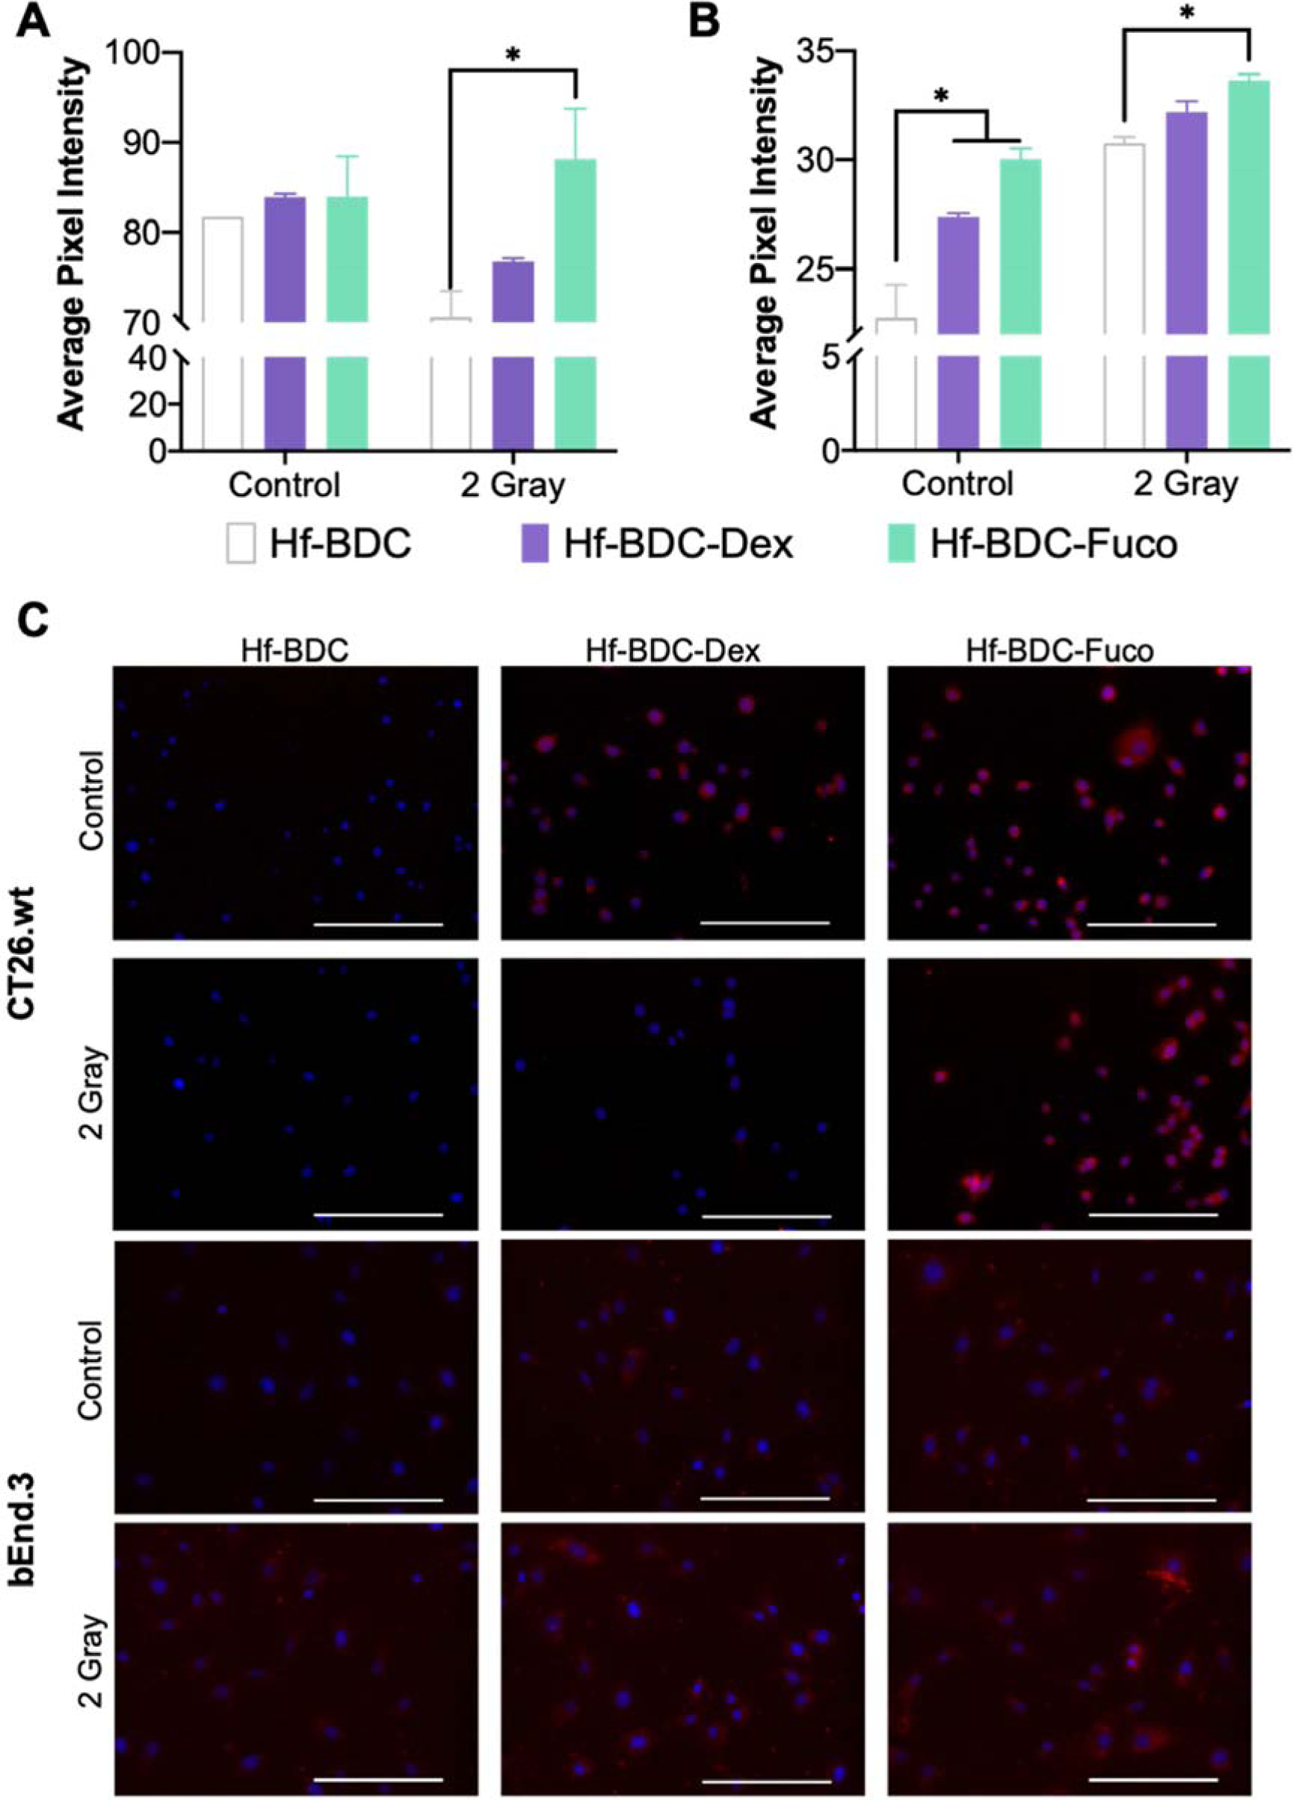
Figure 4.

Average pixel intensity of multiple images for A. CT26.wt amd B. bEnd.3 cells treated with uncoated, dextran coated, or fucoidan coated nMOFs with or without 2 gray. C. Representative images of CT26.wt (top two rows) and bEnd.3 (bottom two rows) cellular uptake used for quantification in A and B. Blue DAPI stain demonstrates nuclei and red shows Cy7.5 loaded nMOF. Scale bars represent 200 μm. Asterisk (*) represents statistically significant difference (p<0.05) analyzed by two-way ANOVA with multiple comparisons.
