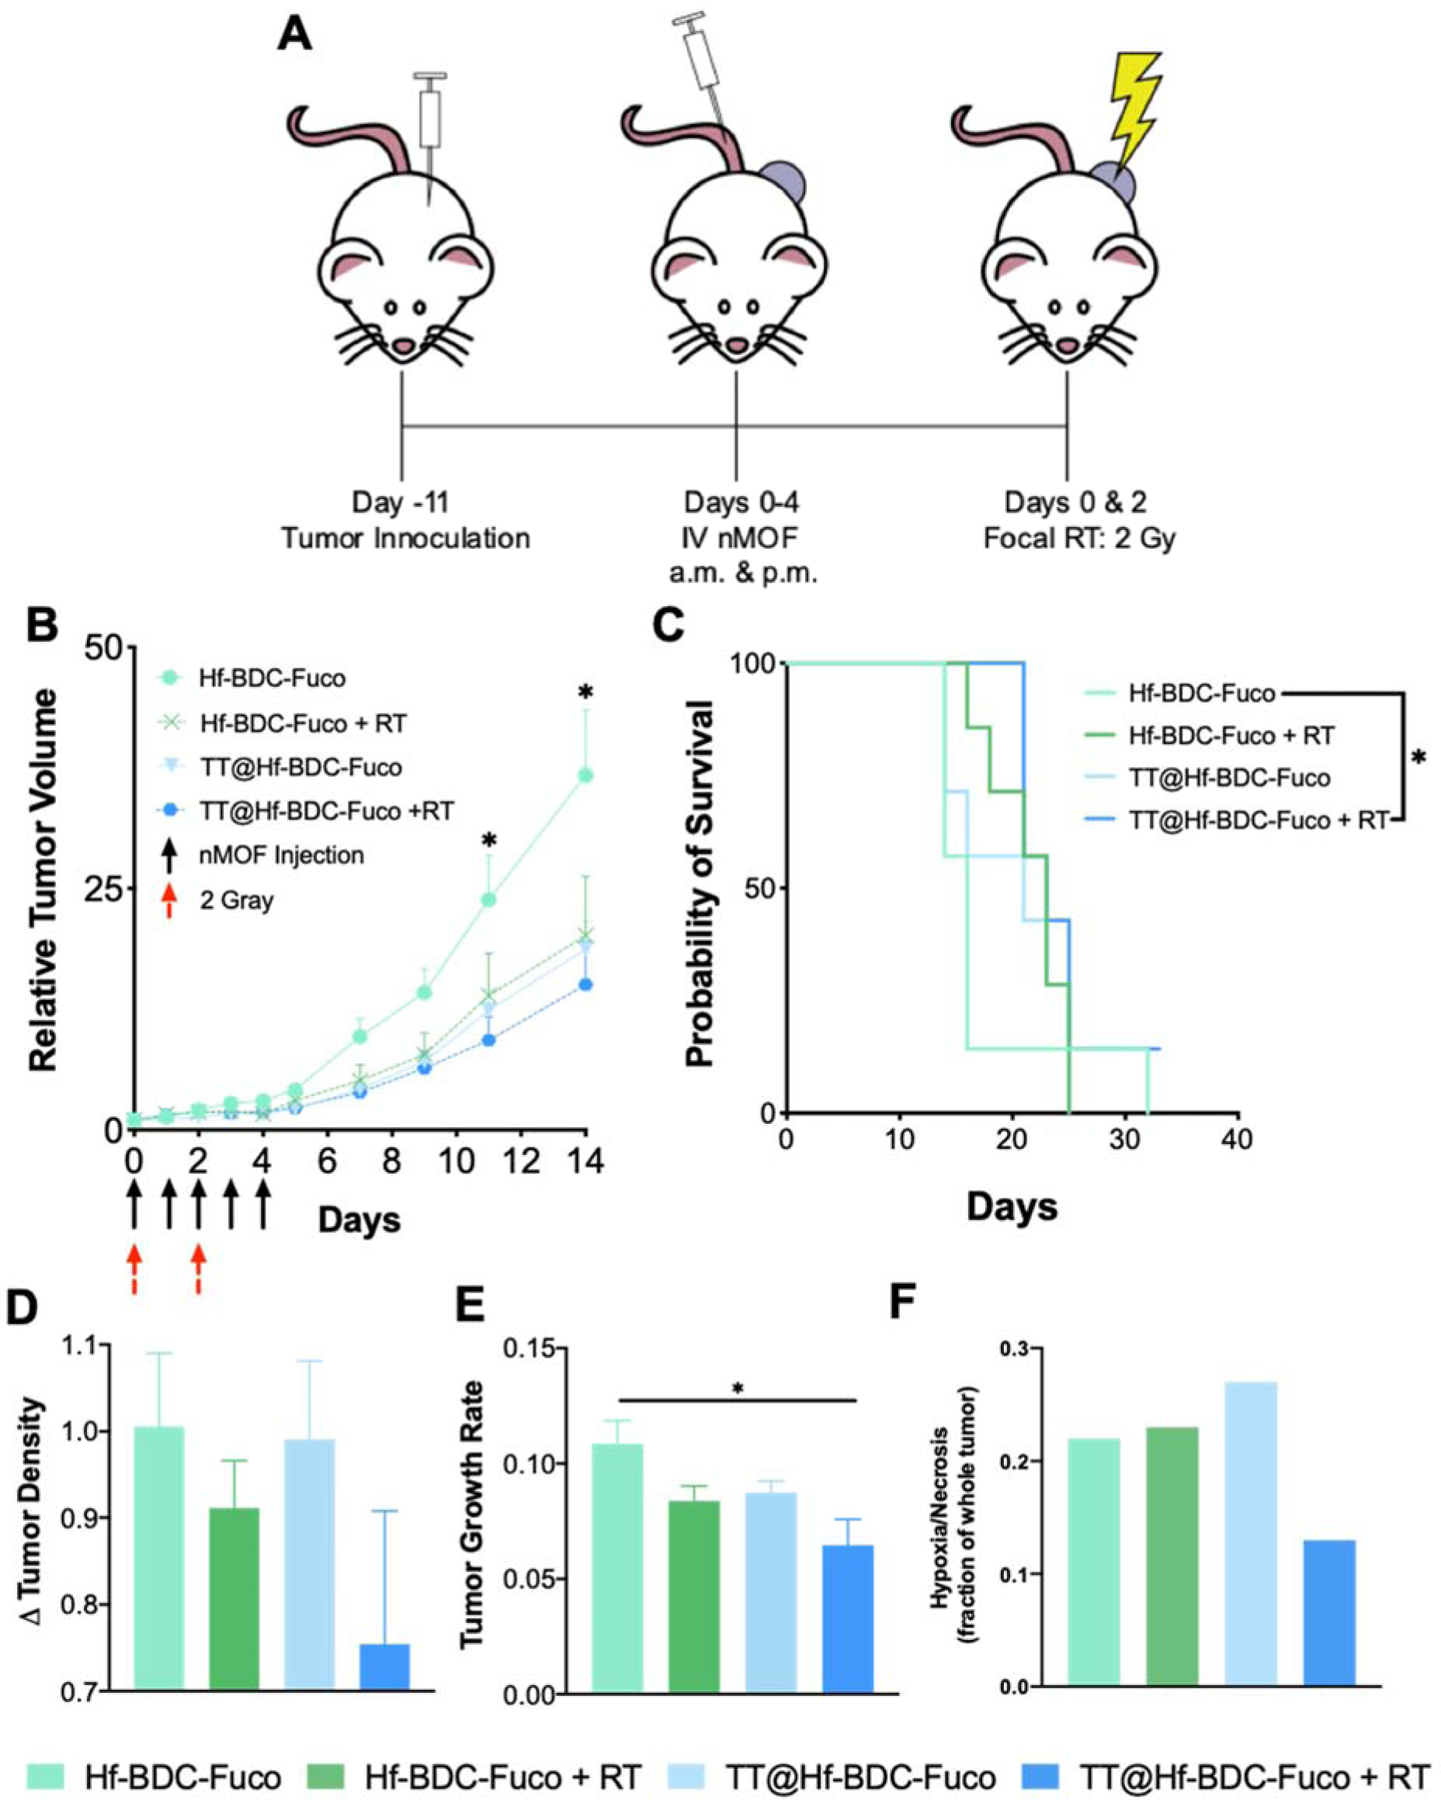
Figure 7.

A. Schematic representation of treatment schedule for efficacy study. B. Tumor growth curves for mice treated with various agents. Asterisks (*) represent statistically significant difference (p<0.05) between Hf-BDC-Fuco and all other groups as analyzed by two-way ANOVA with multiple comparisons. C. Kaplan-Meier survival curve to evaluated treatment efficacy. Asterisks (*) represent statistically significant difference (p<0.05) between Hf-BDC-Fuco and TT@Ht-BDC-Fuco + RT as analyzed by Log-rank (Mantel-Cox) test D. Tumor density values for each treatment group determined by dividing final tumor mass by final tumor volume. E. Tumor growth rate values for each treatment group as determined using base-10 logarithmic scale. Asterisks (*) represent statistically significant difference (p<0.05) between Hf-BDC-Fuco and all other groups as analyzed by one-way ANOVA with multiple comparisons. F. Quantification of hypoxic/necrotic regions as a fraction of whole tumor slice in Supplementary Fig. 8.
