FIGURE 1.

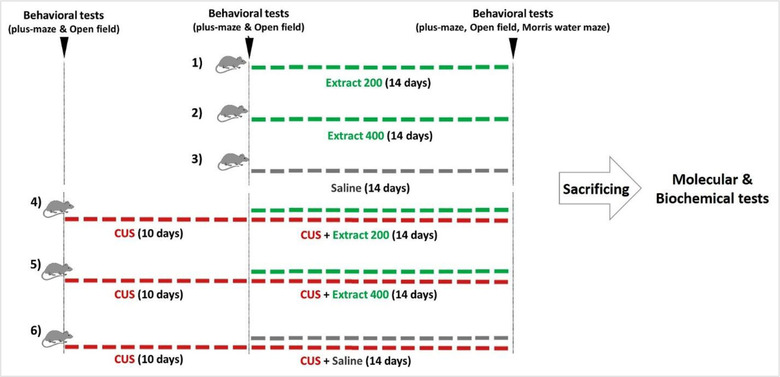
Study experimental design. This diagram shows how each group of rats was treated and when the behavioral and molecular tests were performed.

Study experimental design. This diagram shows how each group of rats was treated and when the behavioral and molecular tests were performed.