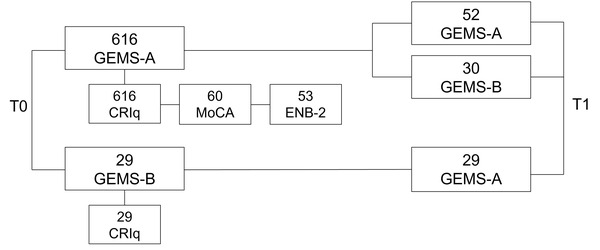
FIGURE 1.

The figure describes the data collection design of GEMS. Blocks on the right part of the figure are the data collected at T0, while blocks on the right side are data collected at T1 (1–3 months after T0). The label in each block refers to the test/questionnaire administered. The number above each test indicates the number of participants data were collected from
