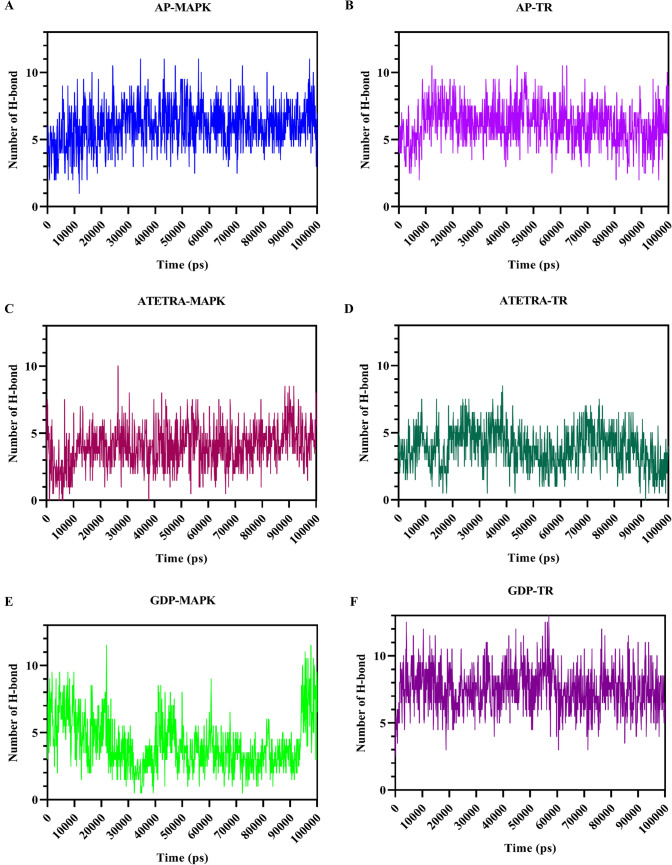
Fig. 7.
Illustration of the formation and breaking of hydrogen bonds over the course of a 100-ns molecular dynamics simulation. The following combinations: A Adenosine pentaphosphate and MAP kinase; B Adenosine pentaphosphate and Trypanothione reductase; C Atetra P and MAP kinase; D Atetra P and Trypanothione reductase; E GDP-4-keto-6-deoxymannose and MAP kinase; F GDP-4-keto-6-deoxymannose and Trypanothione reductase. Due to the larger size of Trypanothione reductase compared to MAP kinase, bond formation was higher for this enzyme

