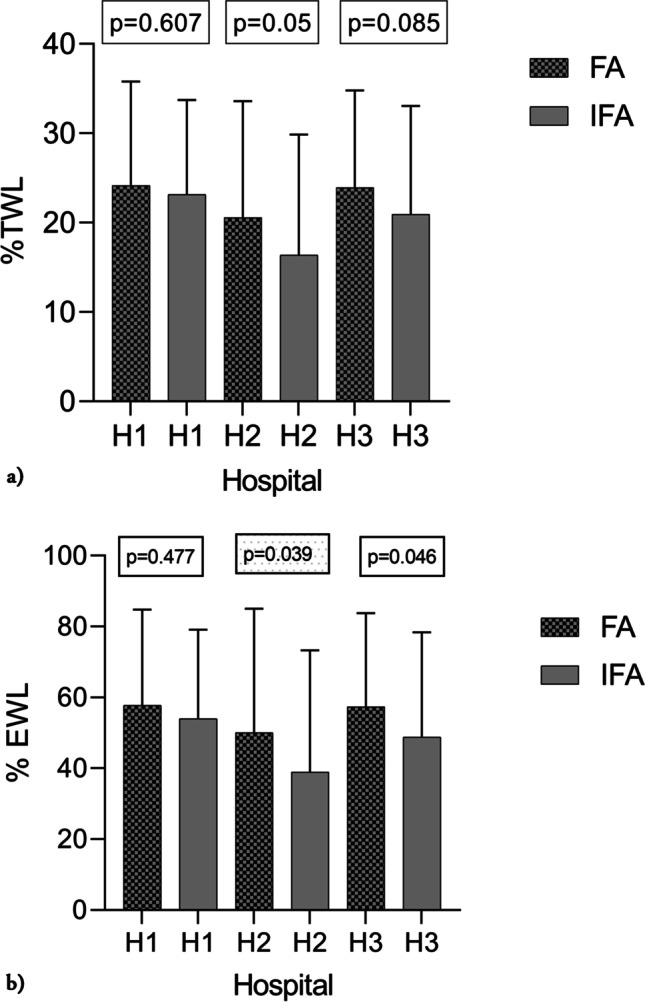
Fig. 3.

a %Total weight loss (%TWL) 12 years after surgery in frequent attendees (FA) and infrequent attendees (IFA) at the educational programs at each of the three hospitals. Results presented as mean ± SD, p-values between FA and IFA at each hospital in box above. b %Excess weight loss (%EWL) 12 years after surgery in frequent attendees (FA) and infrequent attendees (IFA) at the educational programs at each of the three hospitals. Results presented as mean ± SD, p-values between FA and IFA at each hospital in box above
