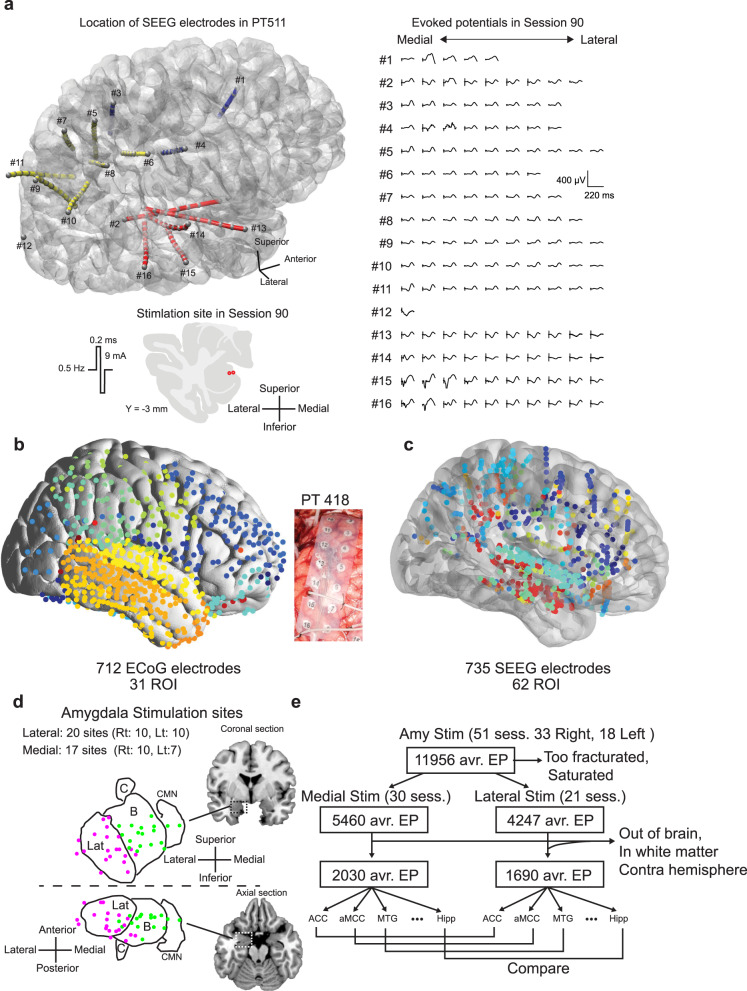
Fig. 1. Electrical stimulation tract tracing (es-TT) in epilepsy patients.
a Representative evoked potentials (EPs) in a patient (PT 511), SEEG (stereotactic electroencephalography) electrodes were inserted from frontal (bule), parietal (yellow) and temporal (red) lobe. Red dots indicate the stimulation site in the amygdala. Stimulus waveform is also shown. b Distribution of subdural ECoG (electrocorticography) electrodes plotted on MNI template brain. All electrodes were classified according Destrieux ROI that are color-coded. Middle picture shows subdural ECoG grid taken during an implantation surgery. c Distribution of SEEG electrodes. Same as (b). d Projection drawing of the amygdala in the coronal and axial planes. Lat; lateral nucleus, B; Basal nucleus complex includes dorsal and intermediate subnuclei of basolateral nucleus, and basomedial nucleus. C; central nucleus, CMN; cortical and medial nucleus. Magenta dots represent the pair of contacts’ midpoints which were used for the lateral group amygdala stimulation. Green dots indicate the midpoint location for medial group amygdala stimulation. The boundary line was placed on the medial edge of lateral nucleus. e Flowchart showing the selection process of evoked potentials for the comparison analysis. Amy; amygdala, Stim; stimulation, avr. EP; averaged evoked potential, sess; session. For the creation of brain backgrounds in panels (a)–(d), we used template ICBM152 Nonlinear brain obtained from http://nist.mni.mcgill.ca/icbm-152-nonlinear-atlases-2009/under Copyright (C) 1993–2004 Louis Collins, McConnell Brain Imaging Centre, Montreal Neurological Institute, McGill University and Conte69.32k surface mesh103 obtained from https://biomedia.doc.ic.ac.uk/brain-parcellationsurvey/) under WU-Minn HCP Consortium Open Access Data Use Terms.

