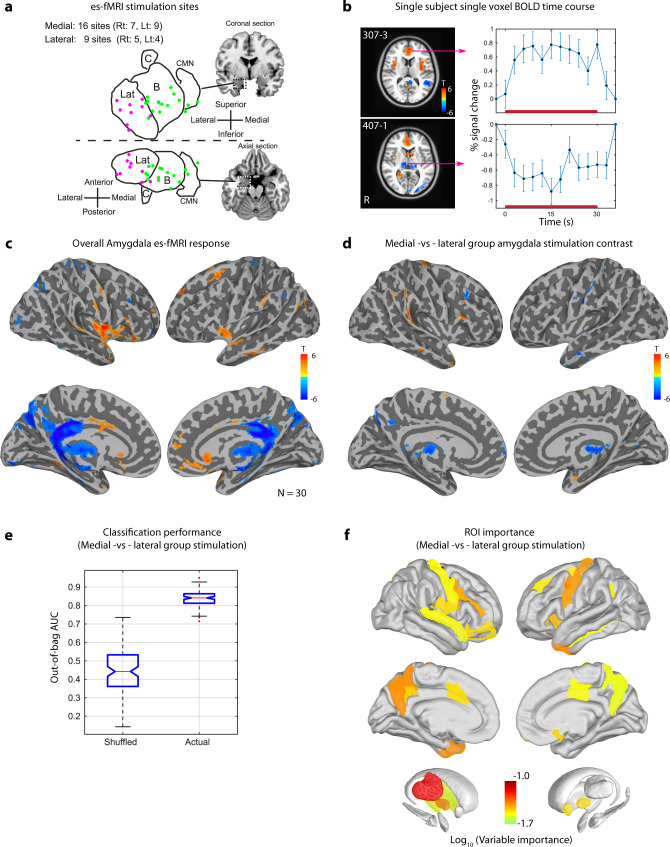
Fig. 3. Amygdala stimulation es-fMRI responses.
a Stimulation sites for es-fMRI shown in colored dots mapped onto right amygdala. Blue and red dots represent midpoint of two adjacent amygdala stimulation contacts for medial (green dots) and lateral group (magenta dots), respectively. Lat: lateral nucleus, B: Basal nucleus complex + basomedial nucleus. C: Central nucleus and CMN: cortical and medial nucleus. Number of stimulation sites (Rt. Right amygdala and Lt. left amygdala) are shown separately for medial group and lateral group stimulation. b Representative single voxel BOLD response time course in two patients. Thresholded at T = 3 and cluster size of 70. Stimulation period is 0 to 30 s and is shown with red horizontal bars above x-axis. Error bars were from 10 es-ON blocks in the es-fMRI run. Mean and SE are shown. c Results from group analysis (multi-level mixed-effect analysis. N = 30 es-fMRI runs over 16 patients, 25 sites stimulated). Resulted statistical map was thresholded (cluster-wise multiple comparison correction through simulation; 3dClustSim, two-sided) at cluster size alpha = 0.02 with primary voxel-wise threshold at P = 0.01. d Group contrast results, medial versus lateral amygdala stimulation. The same threshold was used. See Supplementary Fig. 2 for statistical maps presented in the template volume. e Multivariate classifier result for medial–vs–lateral group stimulation classification. Out-of-bag (oob) area under the receiver operating characteristic curve for original and shuffled data are shown. Edges of box indicate 25 and 75 percentile points along with medians indicated by red horizontal lines. Whiskers indicate minima and maxima. Outliers were indicated by red dots. Width of the notch was defined by 3.14 × (75 percentile points – 25 percentile point)/ N = 100 (Number of classification run) for both actual and shuffled datasets. f ROI distribution that showed significant variable importance (above 95 percentile point of variable importance obtained from shuffled datasets) obtained from the classification above is shown. Color represents log10(variable importance). For the creation of brain backgrounds in panels (a)–(d) and (f), we used template ICBM152 Non-linear brain obtained from http://nist.mni.mcgill.ca/icbm-152-nonlinear-atlases-2009/ under Copyright (C) 1993–2004 Louis Collins, McConnell Brain Imaging Centre, Montreal Neurological Institute, McGill University and Conte69.32k surface mesh103 obtained from https://biomedia.doc.ic.ac.uk/brain-parcellationsurvey/) under WU-Minn HCP Consortium Open Access Data Use Terms.

