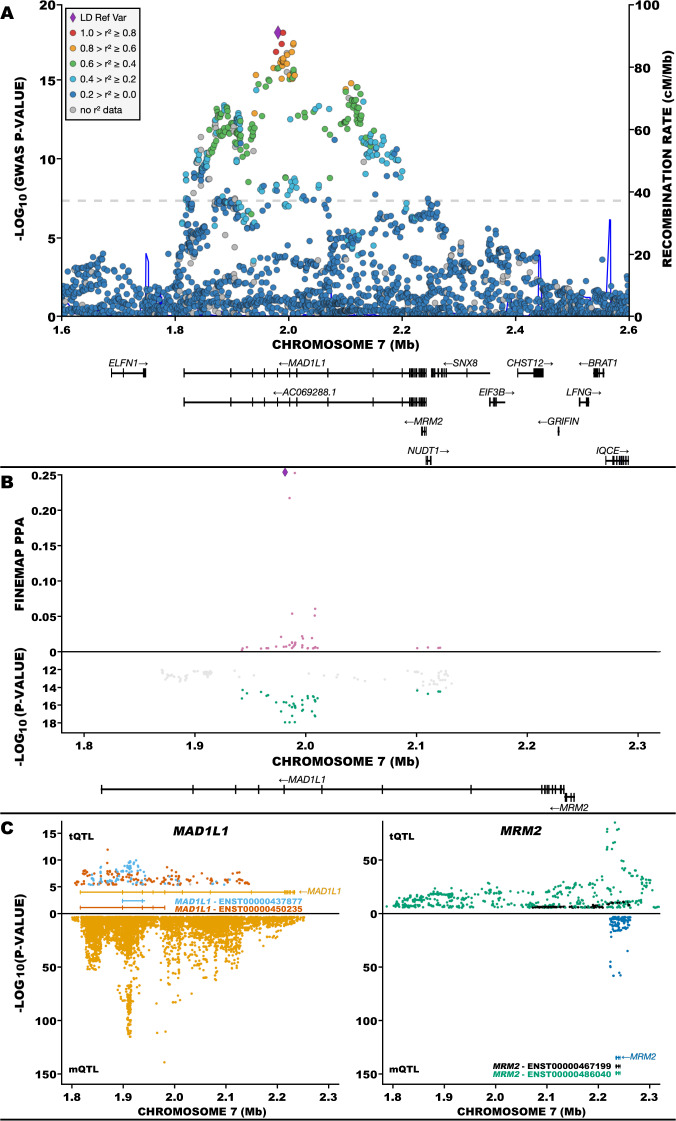
Fig. 3. Fine mapping and colocalization analysis at MAD1L1-containing locus.
A Negative log (base 10) p values for association at chromosome 7p22.3 from a genome-wide association study (GWAS) of schizophrenia [3]. The purple diamond represents SNP rs12668848 (p = 1.110 × 10⁻¹⁸). Not shown: insertion/deletion variants. B Mirror plot of fine-mapping posterior probability (PPA; upper plot) and SZ associations (from A) at chromosome 7p22.3 (lower plot). In the upper plot, the largest PPA was 0.254 (purple diamond). The remaining points are PPA computed on SZ-GWAS SNPs with association p < 5 × 10⁻¹⁵. The lower plot shows SNPs with SZ association p <5 × 10⁻¹². The green points represent SNPs used for fine mapping because they have SZ association p < 5 × 10⁻¹⁵; SNPs not shown have negligible PPA. C Mirror plot of transcript quantitative trait loci (tQTL; upper plots) and methylation quantitative trait loci (mQTL; lower plots) for MAD1L1 (left) and MRM2 (right). The tQTLs and mQTLs were obtained from PsychENCODE [76] and Jaffe et al. [7], respectively. For MAD1L1 (upper left), 95 and 165, out of a total of 262 tQTL SNPs mapped to transcripts ENST00000437877 (teal points) and ENST00000450235 (red points), respectively. For MRM2 (upper right), 154 and 545, out of a total of 699 tQTL SNPs mapped to transcripts ENST00000467199 (black points) and ENST00000480040 (green points), respectively. In the lower half of each plot, mQTLs are depicted that show 11,368 mQTL SNPs mapping to 280 CpG sites associated with MAD1L1 (yellow points; lower left) and 129 mQTL SNPs mapping to 4 CpG sites associated with MRM2 (blue points; lower right).

