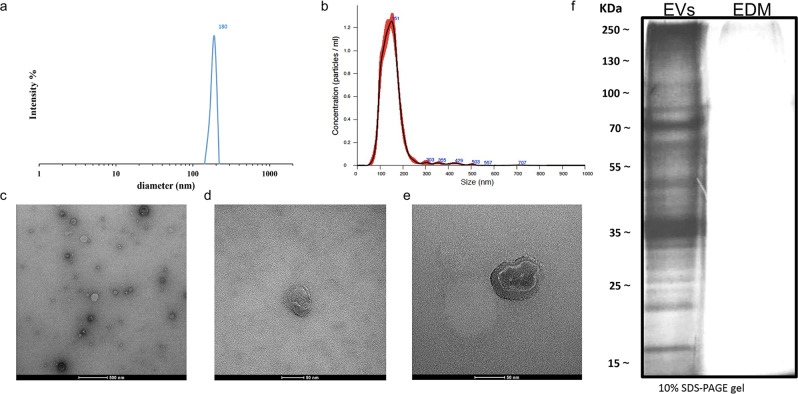
Fig. 2. Biophysical characterization of HR-derived EVs.
a EVs size distribution curve obtained by dynamic light scattering (DLS). b Nanoparticle Tracking Analysis (NTA) measurements show the distribution of the EV size with the major peak at 151 nm. c TEM image of isolated vesicles exhibiting round-shaped morphology. d, e Close-up view images of individual HR-derived EVs. f Protein pattern of HR-derived EVs and EV depleted-medium (EDM) visualized by SDS-PAGE and silver staining. Silver staining of EDM did not show detectable proteins. Scale bars: 500 nm in c, 50 nm in d, 50 nm in e.

