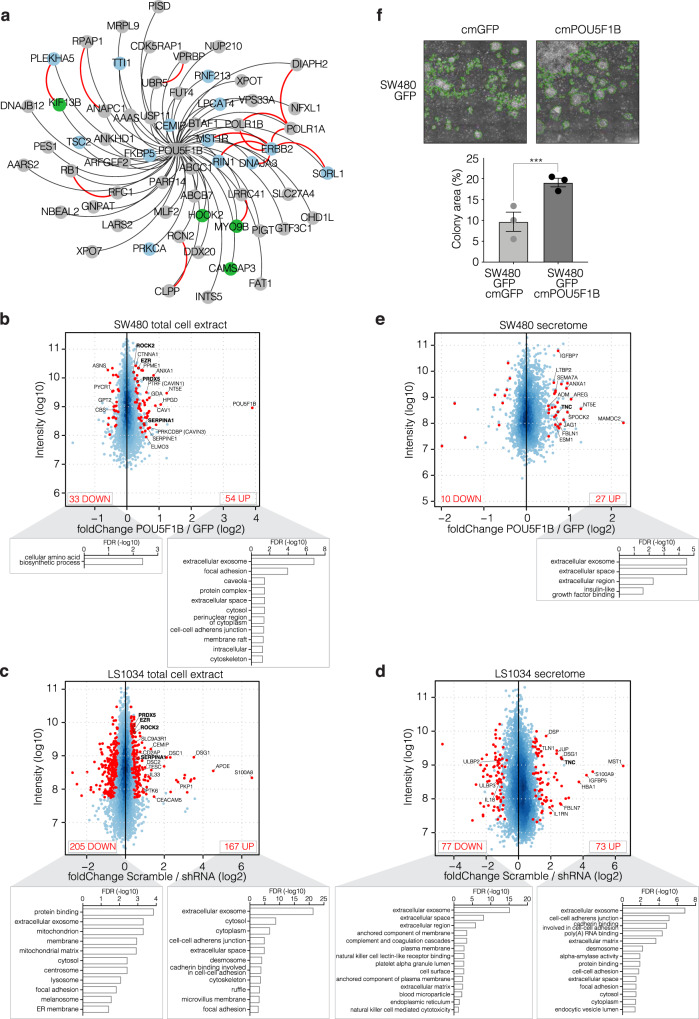
Fig. 5. Proteomic characterization of POU5F1B-induced molecular changes.
a High-confidence interactome of POU5F1B detected by AP/MS in HT29 and LS1034 CRC cells overexpressing POU5F1B-HA. Weighted black edges are based on the average fold change over controls (n = 12 samples, 4 conditions, 3 replicates/condition; all depicted interactions have a fold change over controls >5 and P < 0.01). Red edges depict previously documented protein-protein interactions. Interactors with signaling functions are highlighted in blue and cytoskeleton-related proteins in green. b–e MA plot depicting relative abundance and average intensity of individual proteins identified by SILAC in total cell extracts (b, c) or in the secretome (d, e) of POU5F1B- vs. GFP-overexpressing SW480 cells (b, e) or in sh-scramble vs. shRNA3 & shRNA5 LS1034 cells (c, d). All SILAC measurements were performed in independent duplicates, each dot represents a detected protein, with significantly changed ones (P < 0.05, outlier detection test as computed by MaxQuant) in red and their numbers indicated in upper corners. Names in bold are for proteins common to the corresponding settings in both cell lines. Significantly enriched proteins were clustered in GO terms using the Functional Annotation Chart from DAVID bioinformatics resources 6.8. f Conditioned-medium colony formation assay; GFP-overexpressing SW480 cells form bigger colonies when exposed to POU5F1B- rather than GFP-conditioned medium (cm). A green line delimits the quantified area in representative pictures (n = 3 independent experiments with 3 replicates; P = 1.27e–05 by two-sided t-test). Data presented as mean ± s.e.m., with single values as circles. Source data are provided as a Source Data file.

