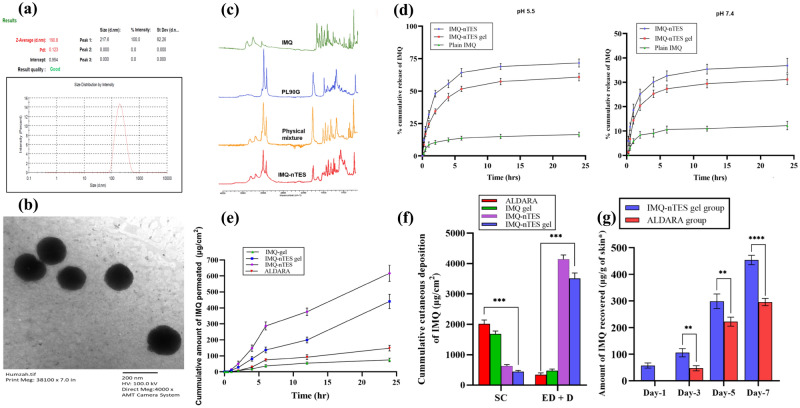
Figure 4.
(a) Vesicle size and PDI of optimized IMQ-nTES. (b) TEM micrograph of optimized IMQ-nTES. (c) FTIR of IMQ-nTES and its component. (d) In vitro IMQ release pattern at pH 5.5 and pH 7.4. (e) Ex vivo skin permeation of IMQ. (f) Cumulative amount of IMQ deposition in rat skin. (g) IMQ amount recovered from stripped skin of disected BALB/c mice from IMQ-nTES gel and ALDARA group. Data is presented as mean ± S.D, n = 3; *p < 0.05, **p < 0.01, ***p < 0.001, nsp > 0.05. SC stratum corneum, ED epidermis, D dermis.

