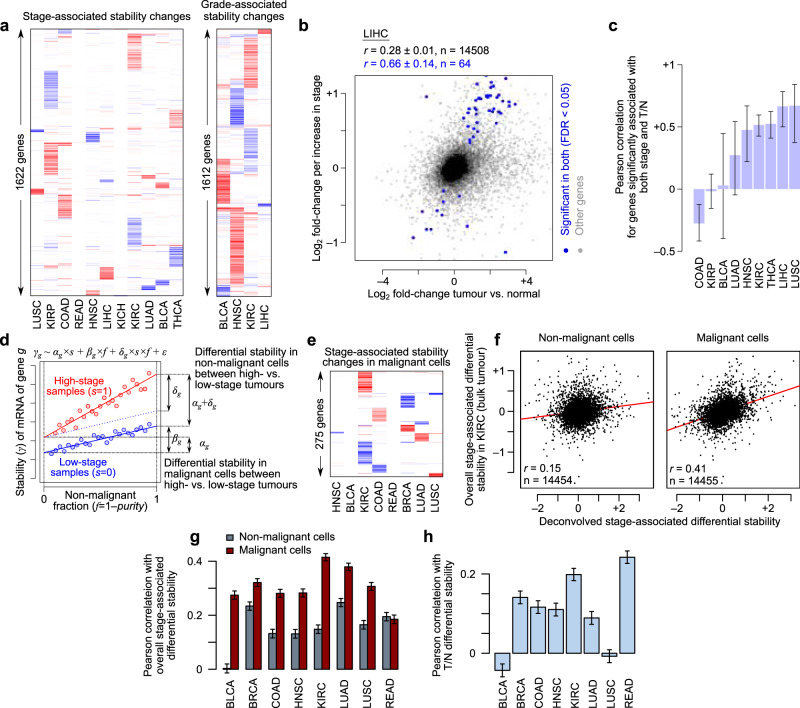
Fig. 3. Stage- and grade-associated mRNA stability changes.
a The mRNA stability changes associated with tumour stage (left) and grade (right) across TCGA cancers. Genes with significant changes in at least one cancer at FDR < 0.05 are included. The colour gradient is the same as in Fig. 2b. b Comparison of the differential mRNA stability between tumour and normal (x-axis) and stage-associated differential mRNA stability (y-axis), in the TCGA-LIHC dataset as an example. Genes with significant changes along both axes at FDR < 0.05 are coloured in blue. Pearson correlation coefficients and confidence intervals for all genes (black) and significant ones (blue) are shown on top. Panel (c) summarizes the Pearson correlations for significant genes in other cancer types (error bars represent the confidence intervals). d Schematic illustration of the model used for deconvolving the stage-associated changes in malignant and non-malignant cells. The equation on top represents the model used, with the interpretation of model coefficients shown on the plot. See Methods for details. e Stability changes associated with tumour stage across TCGA cancers that could be assigned to cancerous/pre-cancerous cells. Genes with significant DiffRAC results in at least one cancer (FDR < 0.05) are included. The colour gradient is the same as in Fig. 2b, with the exception that the log2 fold-change of mRNA stability ranges from −1 to 1 here. f Comparison of the stage-associated differential mRNA stability in non-cancerous cells (x-axis, left) or cancerous/pre-cancerous cells (x-axis, right) to the non-deconvoluted estimates (y-axis) in the TCGA-KIRC dataset. Pearson correlation coefficients and p values are shown on the plot. Panel (g) shows this Pearson correlations across all cancer types for non-cancerous (gray) and cancerous/pre-cancerous cells (red). Error bars represent the 95% confidence intervals. h The Pearson correlation between tumour vs. normal (T/N) differential stability and the deconvoluted stage-associated differential mRNA stability. Only cancer types with at least 5 significant deconvoluted stage-associated genes are shown. Error bars represent the 95% confidence intervals.

