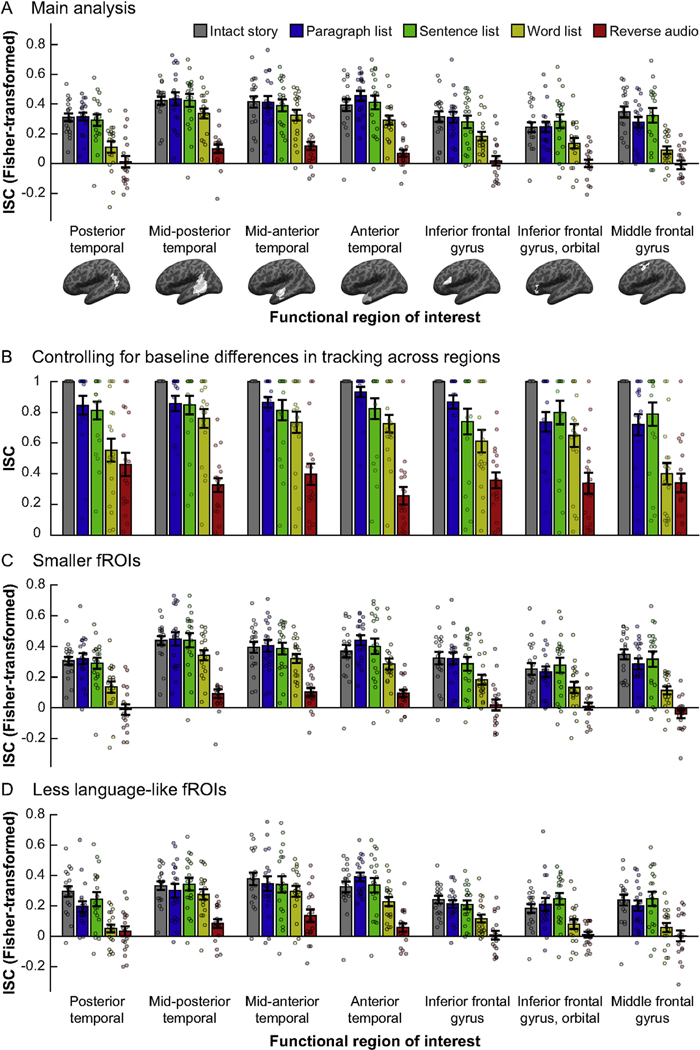
Fig. 2.
Comparing temporal receptive windows (TRWs) across core language regions. In each panel, inter-subject correlations (ISCs, a proxy for input tracking reliability; y-axis) are shown for each condition (bar colors) in each fROI (x-axis; brain images depict whole masks, but data are for participant-specific fROIs defined within those masks, as elaborated in Methods). Dots show individual data points, bars show means across the sample, and error-bars show standard errors of the mean. (A) Main analysis. (B) ISCs normalized relative to a “baseline” measure of tracking per fROI, i.e., the intact story condition. (C) ISCs in smaller fROIs, defined as the top 4% of voxels in each mask that showed the biggest sentences > nonwords effect in the localizer task, rather than the top 10% as in (A). (D) fROIs defined as the “fifth-best” 4% of voxels in each mask, i.e., those whose effect size for the localizer contrast was in the 80–84 percentile range. ISCs in all panels, except for panel B, were transformed from the original Pearson’s correlation scale to the Fisher-transformed scale.

