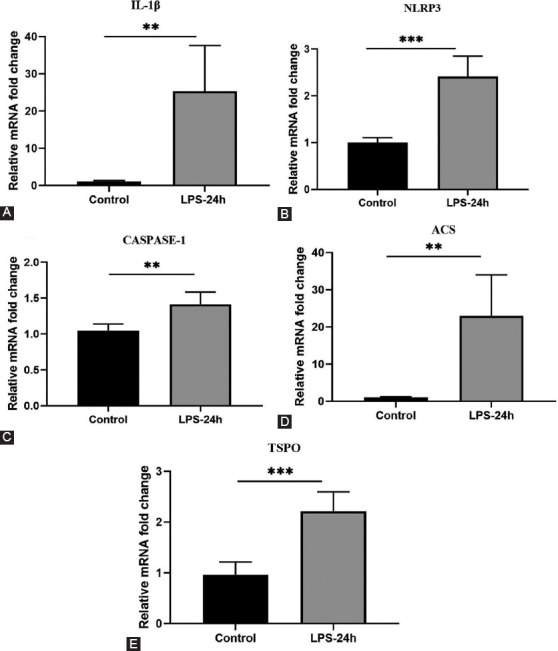
FIGURE 6.

Detection of cytokine changes in the hippocampus of LPS-24 hours mice. (A-E) Real-time PCR analysis of IL-1β, NLRP3, CASPASE-l, ASC, TSPO (n = 5/group). All data are expressed as the mean ± SEM. t-test used by*p < 0.05, **p < 0.005, compared to normal control.
