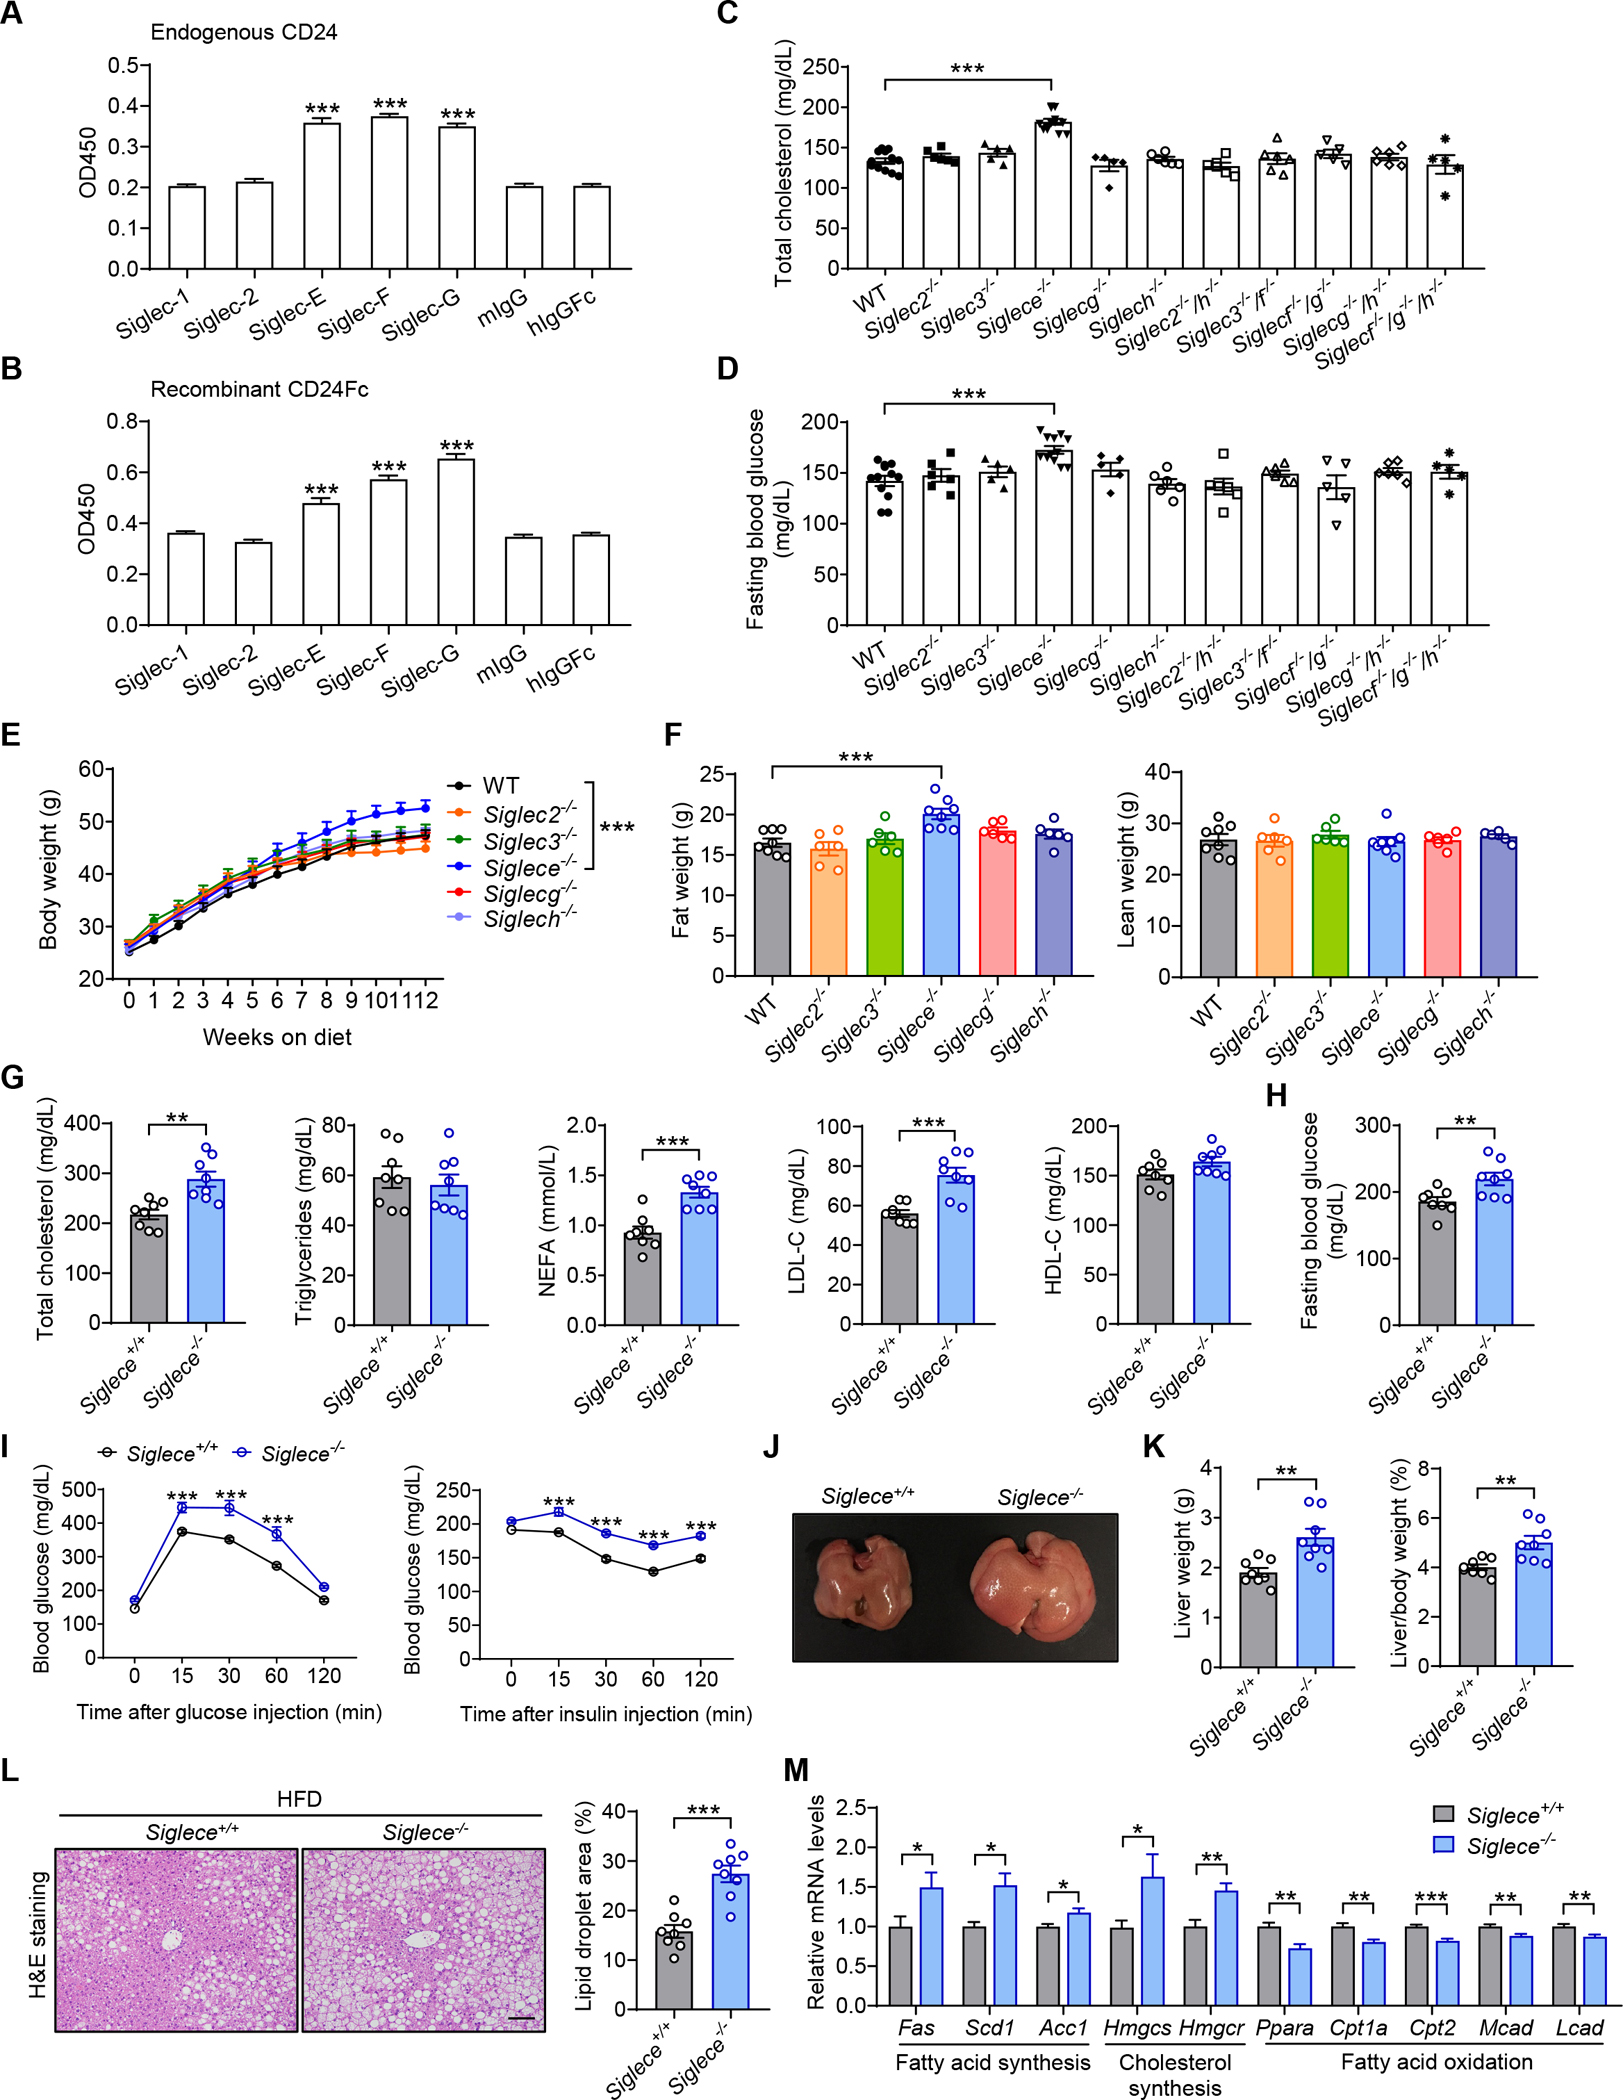
Figure 3. Siglec-E is the CD24 receptor that protects against metabolic syndrome.

(A) Interactions between endogenous CD24 and recombinant Siglecs. n = 3 per group.
(B) Direct interactions between CD24Fc and recombinant Siglecs. n = 3 per group. </p/>(C and D) Siglec-deficient mice were maintained on a normal diet. Serum levels of total cholesterol (C) and fasting blood glucose (D) were detected at 8 months of age. n = 5–12 per group. </p/>(E and F) WT and Siglec-deficient mice were fed a HFD for 12 weeks. Body weight (E) and body composition (F) were detected. n = 6–8 per group. </p/>(G-M) Siglece−/− mice and WT littermates were fed a HFD for 12 weeks.
(G) TC, TG, FFA, LDL-C and HDL-C levels of mice in the indicated groups. n = 8 per group.
(H) Fasting blood glucose levels of mice in the indicated groups. n = 8 per group.
(I) GTT and ITT results of mice in the indicated groups. n = 6 per group.
(J) Photographs of representative livers from mice in the indicated groups.
(K) Liver weight and liver/body weight ratio of mice in the indicated groups. n = 8 per group.
(L) Representative images of H&E staining of liver sections. Scale bar, 100 μm. Graph shows the quantitation of lipid droplet area. n = 8 per group.
(M) Relative mRNA levels of key metabolic genes in the livers from mice in the indicated groups. n = 8 per group.
Data are mean ± SEM and representative of two or three independent experiments. *p < 0.05, **p < 0.01, ***p < 0.001, unpaired Student’s t-test (G, H, K-M), one-way analysis of variance (ANOVA) (A-D, F) or two-way analysis of variance (ANOVA) (E, I). See also Figures S3 and S4.
