
Figure 4. Siglec-E signaling is required for CD24-mediated protection against metabolic disorder.
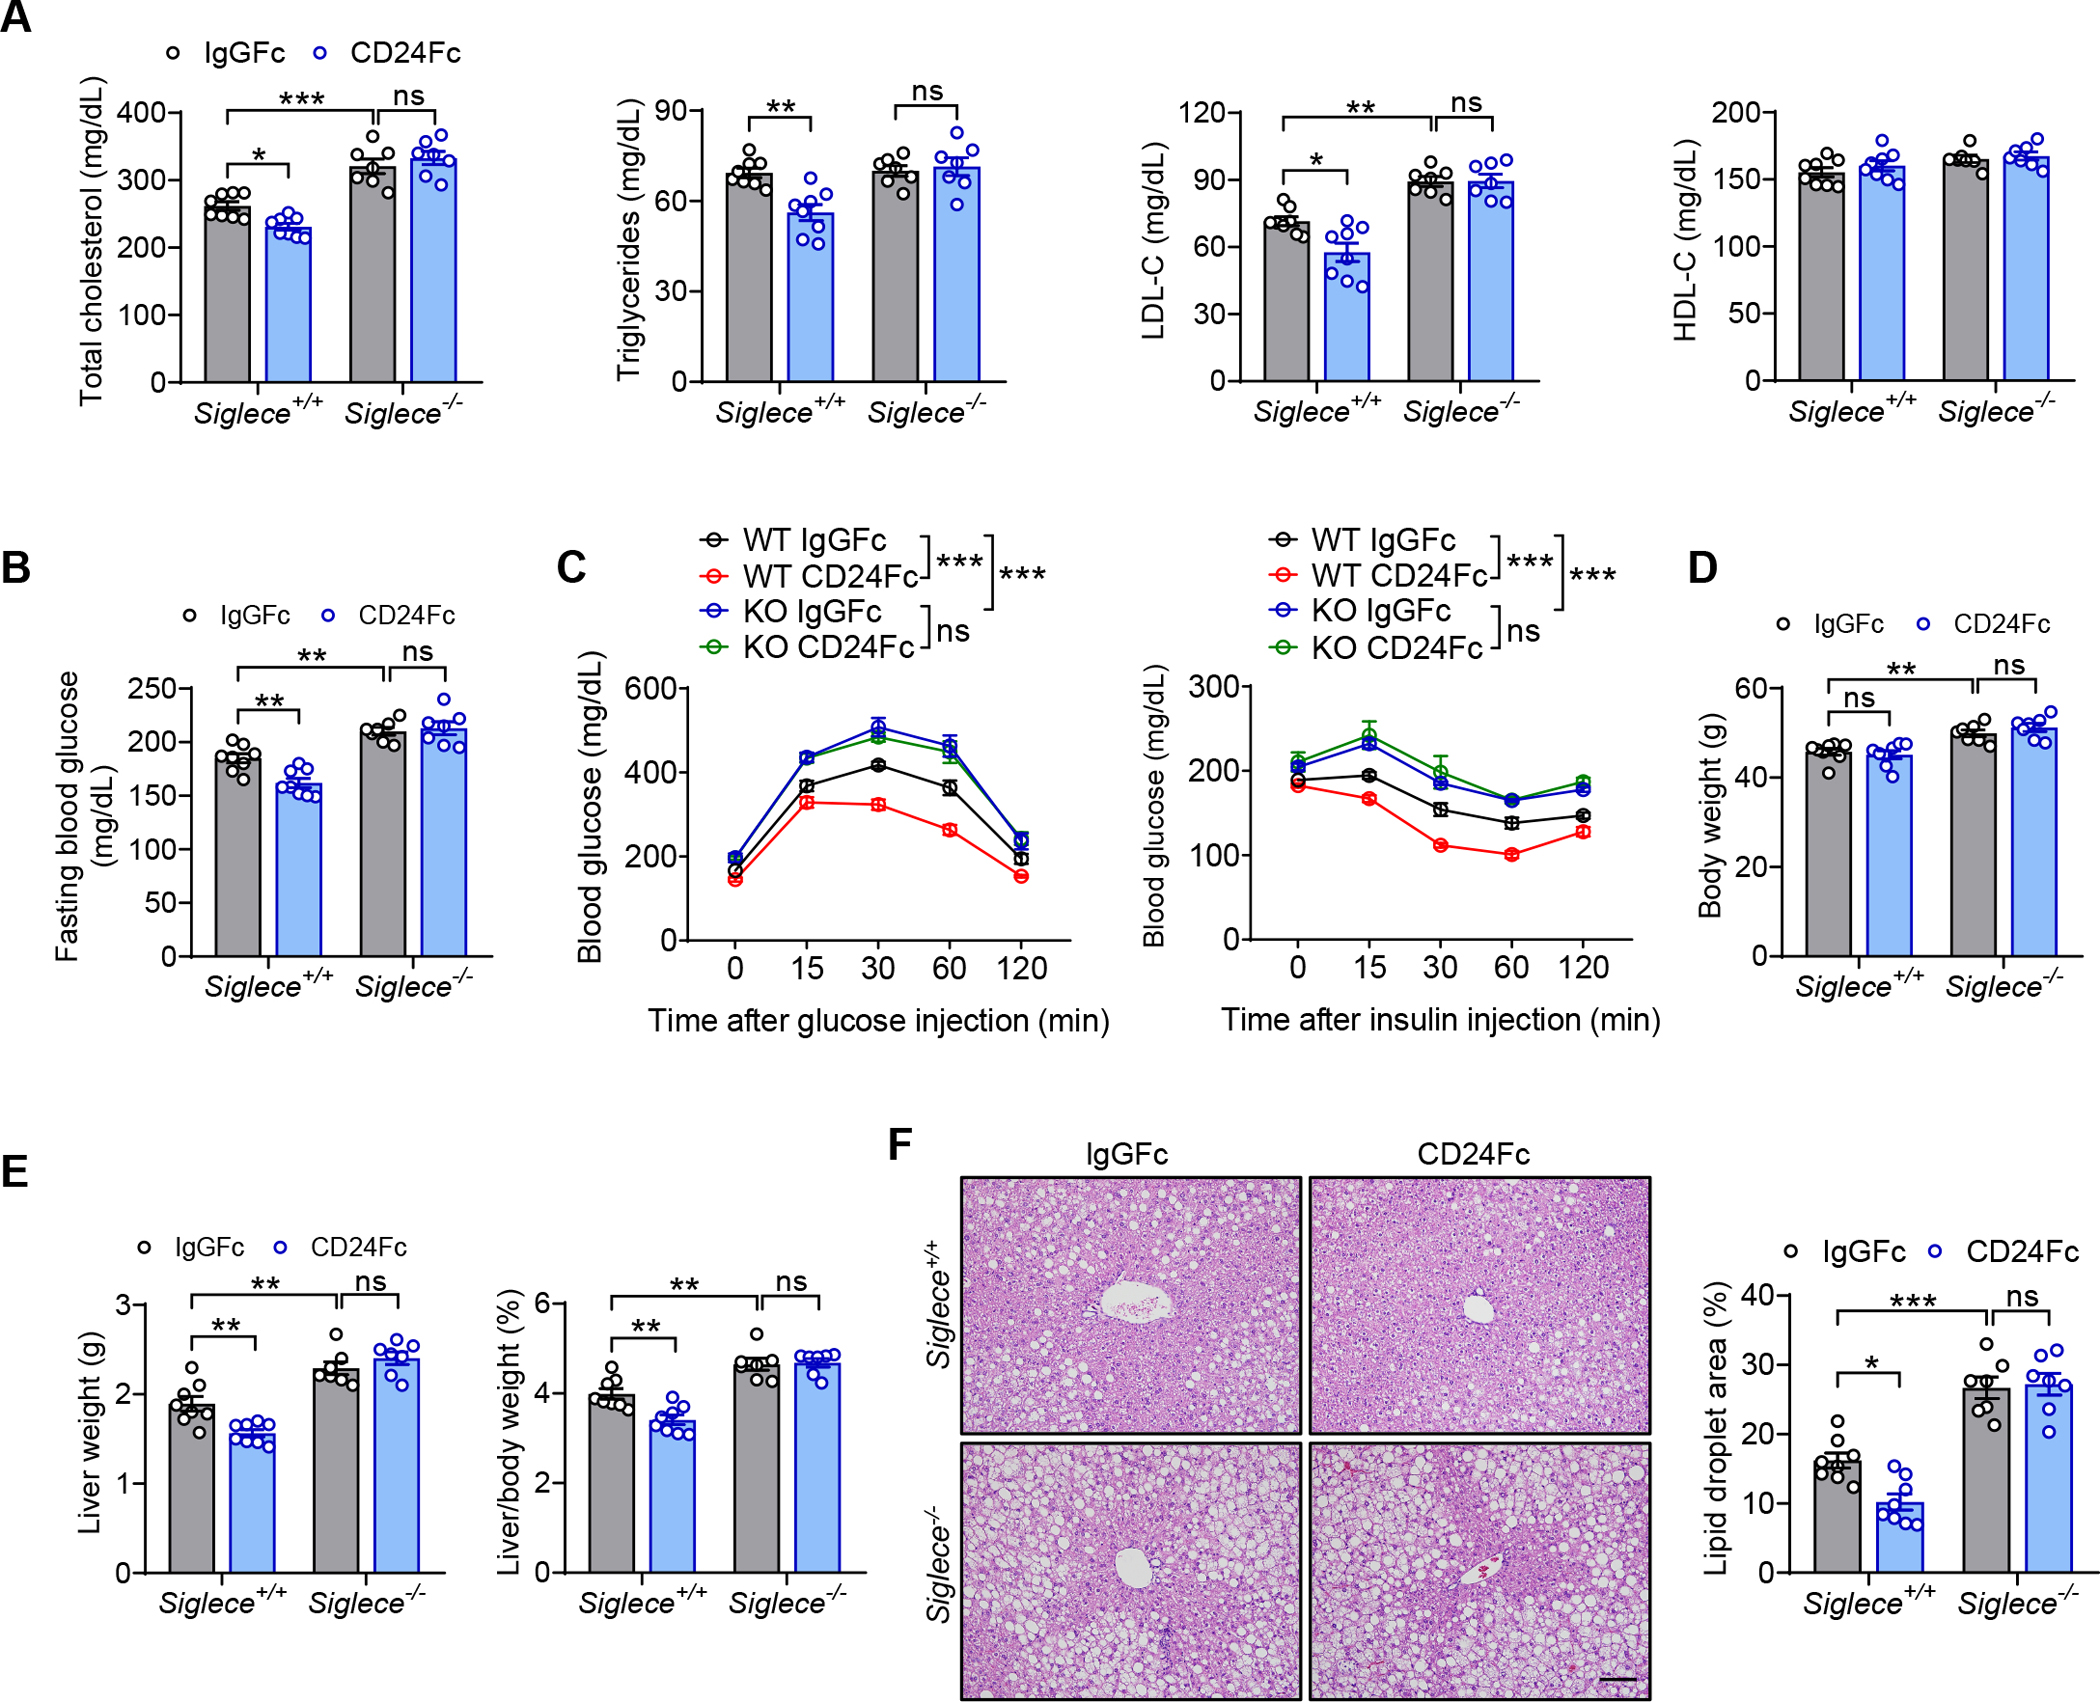
(A-F) Siglece−/− mice and WT littermates were fed a HFD for 8 weeks, followed by injection of CD24Fc or IgGFc control twice a week for 4 weeks while continuing HFD.
(A) TC, TG, LDL-C and HDL-C levels of mice in the indicated groups. n = 7–8 per group.
(B) Fasting blood glucose levels of mice in the indicated groups. n = 7–8 per group.
(C) GTT and ITT results of mice in the indicated groups. n = 6 per group.
(D) Body weight of mice in the indicated groups. n = 7–8 per group.
(E) Liver weight and liver/body weight ratio of mice in the indicated groups. n = 7–8 per group.
(F) Representative images of H&E staining of liver sections. Scale bar, 100 μm. Graph shows the quantitation of lipid droplet area. n = 7–8 per group.
Data are mean ± SEM and representative of two independent experiments. *p < 0.05, **p < 0.01, ***p < 0.001, two-way analysis of variance (ANOVA).