
Figure 7. CD24Fc regulates lipid metabolism and inflammation in humans.
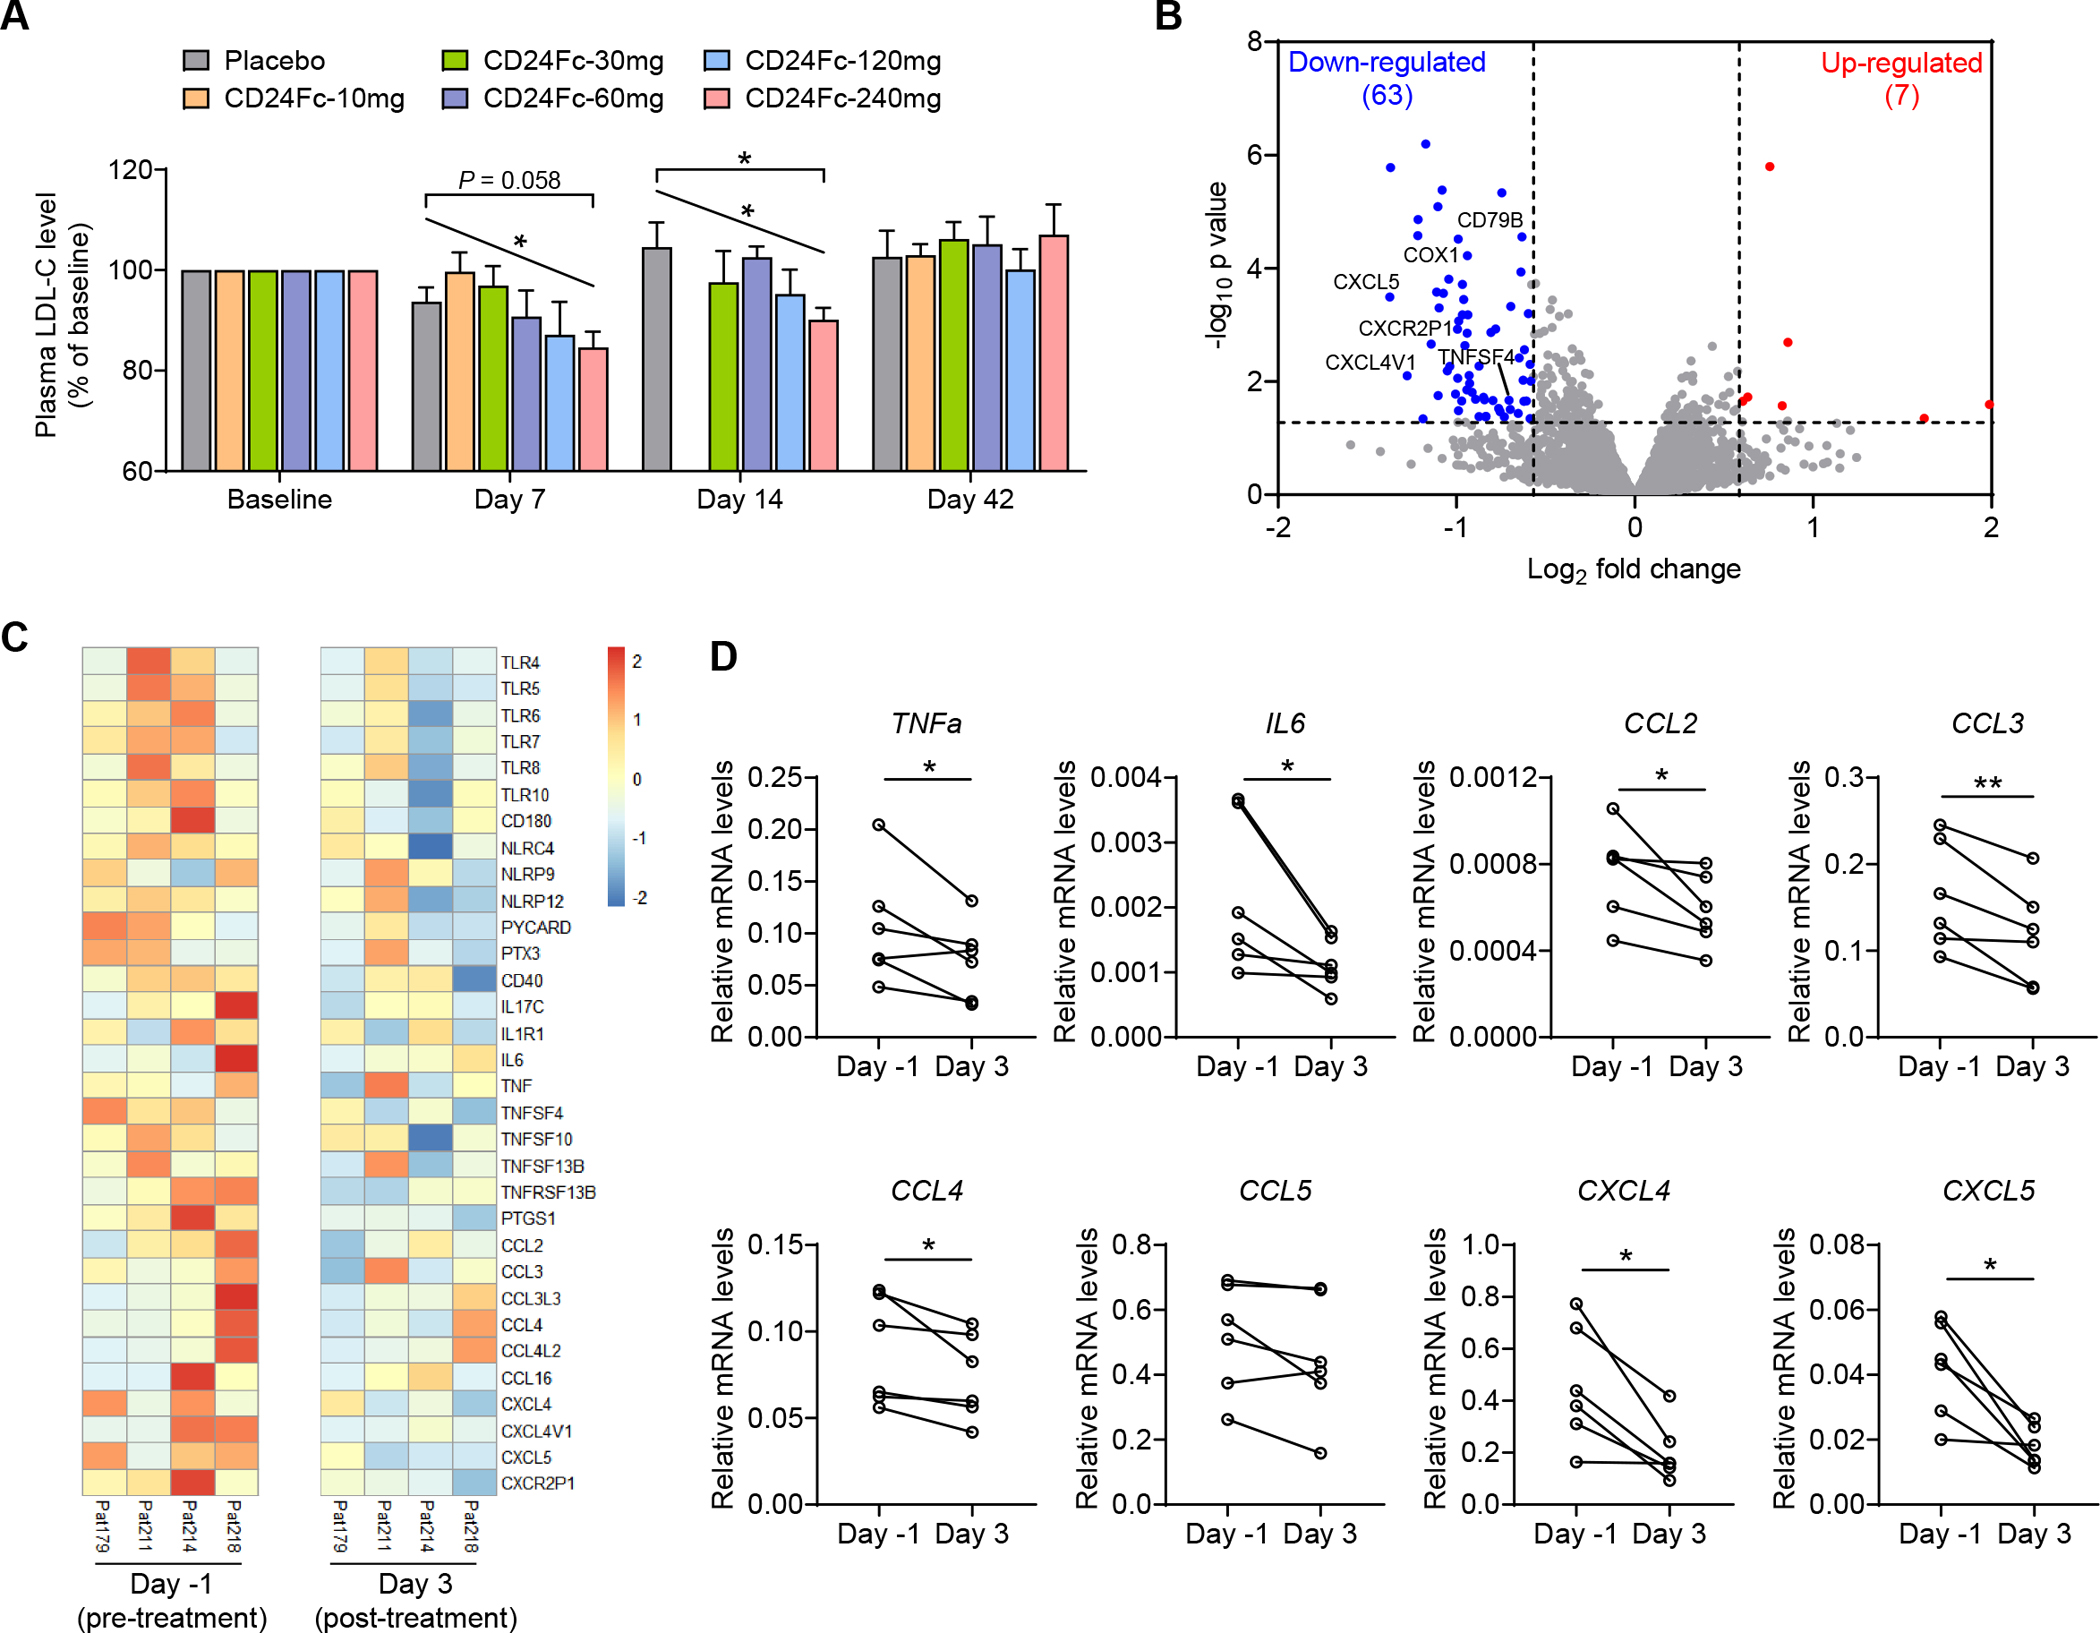
(A) The human subjects were treated with a single dose of placebo or CD24Fc at different doses (10, 30, 60, 120 and 240 mg per injection). Plasma LDL-C levels were detected at pre-dosing baseline, and at 7, 14 and 42 days after dosing. Relative LDL-C levels were normalized to the baseline. LDL-C of Day 14 samples in 10 mg group were not measured. n = 5–10 per group.
(B and C) RNA-sequencing was performed on PBMC samples obtained on Day −1 (pre-treatment) and Day 3 (post-treatment) from subjects receiving 240 mg of CD24Fc. All samples that pass quality control were used. </p/>(B) Volcano plot analysis. Significantly differentially expressed genes (P < 0.05 and fold change > 1.5) were highlighted in red (up-regulated) and blue (down-regulated). Selected genes related to inflammation were indicated.
(C) Heat map of alterations in expression of inflammatory genes.
(D) Expression of inflammatory genes in PBMC samples was validated by real-time PCR. Gene expression levels were calculated after normalization to the housekeeping gene GAPDH.
Data are mean ± SEM. *p < 0.05, **p < 0.01, one-way analysis of variance (ANOVA) for multiple comparisons (A), linear regression analysis for dose-dependency (A) or paired t-test (D). See also Figure S7.