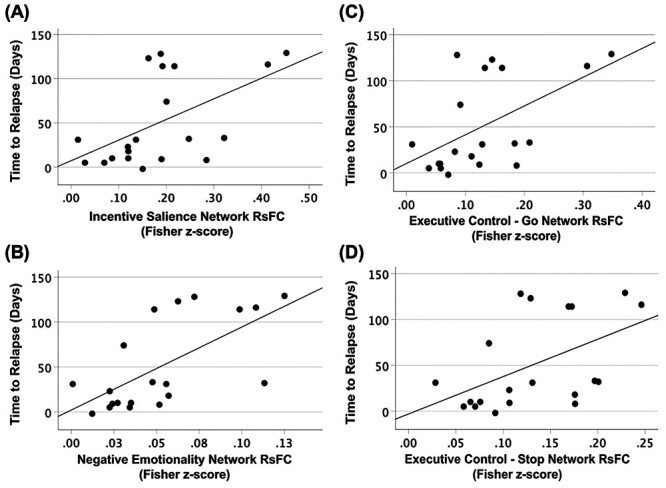
Figure 6.

Linear regression scatter plots showing significant association between time to relapse (measured in days) and resting-state functional connectivity (RSFC) in the (A) incentive salience (t = 2.70, P = 0.015, β = 0.537), (B) negative emotionality (t = 3.63, P = 0.002, β = 0.650), (C) executive control—Go (t = 2.719, P = 0.014, β = 0.540), and (D) executive control—Stop (t = 2.451, P = 0.025, β = 0.500) addiction networks.
