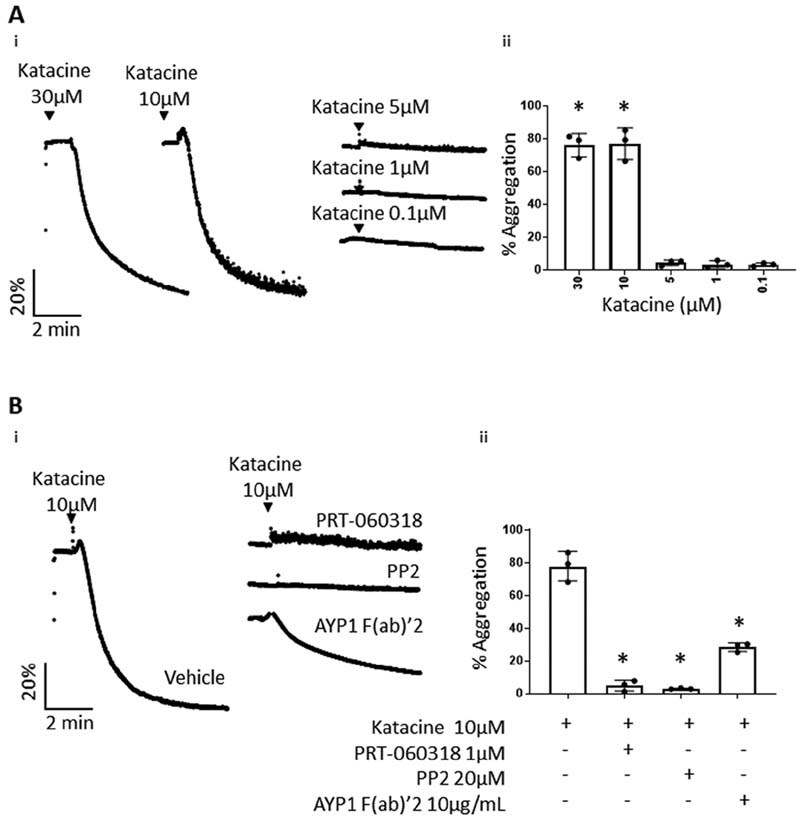
Fig. 2.

Katacine induces platelet aggregation. ( A-i ) Representative traces of washed platelets (2 × 10 8 platelets/mL) stimulated by different doses of katacine (0.1–10 µM) and panel ( A-ii ) represents bar columns of the mean + SD of three independent experiments. ( B-i ) Representative traces of washed platelets pretreated by the Syk and Src inhibitors, PRT-060318 at 1 µM and PP2 at 20 µM, respectively, or by the mouse anti-CLEC-2 antibody, AYP1 (10 µg/mL), and panel ( B-ii ) shows the mean ± SD of three independent experiments. The Kruskal–Wallis one-way ANOVA test was used to evaluate significant differences between the treatment in relation with the control; the symbol “*” represents significance differences where p < 0.05, as stated. ANOVA, analysis of variance; SD, standard deviation.
