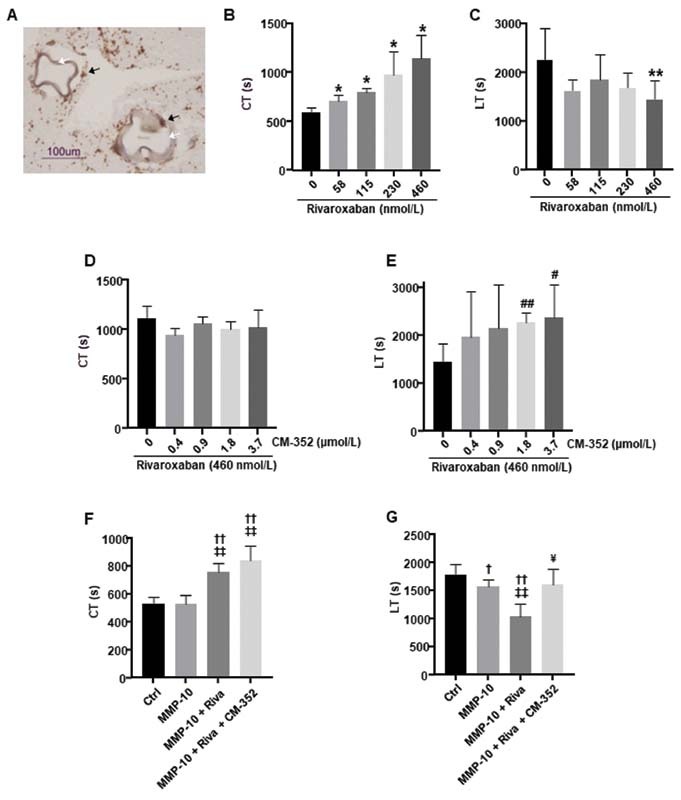
Fig. 3.

Thromboelastometric analysis with adherent EC microcarriers using human whole blood samples. (A) Representative image of CD31-positive cells ( brown, black arrows ) surrounding the surface of Cytodex 3 EC microcarriers ( white arrows ) in a blood clot obtained by ROTEM. Scale bar = 100 µm. (B) Clotting time (CT) and (C) lysis time (LT) in the presence of 58, 115, 230, or 460 nmol/L of rivaroxaban. (D) CT and (E) LT in the presence of 0.4, 0.9, 1.8, or 3.7 µmol/L of CM-352 and 460 nmol/L of rivaroxaban. (F) CT and (G) LT in the presence of MMP-10 (200 nmol/L), rivaroxaban (460 nmol/L), and CM-352 (1.8 µmol/L). CT and LT times expressed in seconds (s) are presented in the graphs. Mean ± SD, * p < 0.05 and ** p < 0.01 vs. 0 nmol/L; # p < 0.05 and ## p < 0.01 vs. 0 µmol/L; † p < 0.05 and †† p < 0.01 vs. Ctrl; ‡‡ p < 0.01 vs. MMP-10; ¥ p < 0.05 vs. MMP-10 + Riva, using Kruskal–Wallis and Mann–Whitney U-test, n ≥ 3/group. EC, endothelial cell; ROTEM, rotational thromboelastometry; SD, standard deviation; TAFI, thrombin-activatable fibrinolysis inhibitor.
