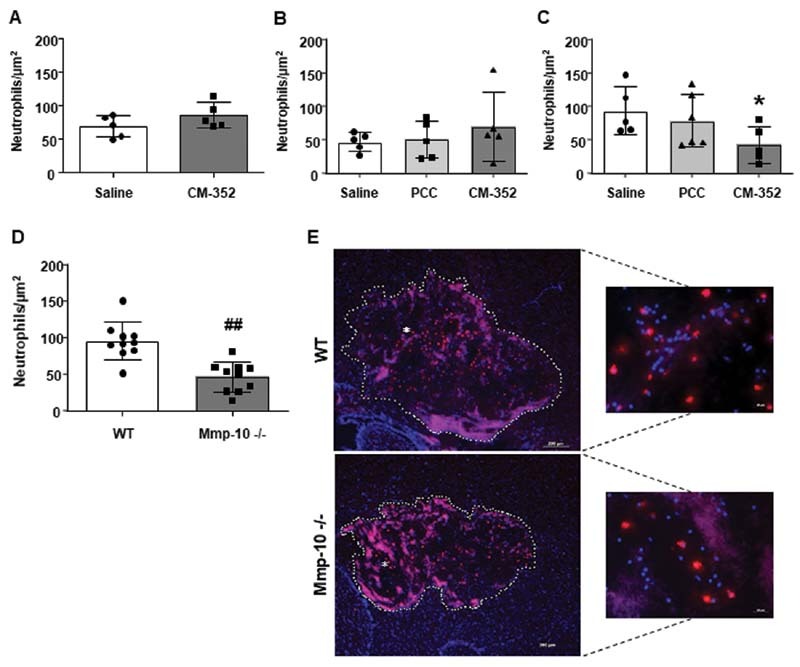
Fig. 6.

Local inflammation 24 hours after experimental ICH. Neutrophil infiltration in the hemorrhage area of (A) nonanticoagulated, (B) warfarin, and (C) rivaroxaban anticoagulated mice. (D) Neutrophil infiltration in the hemorrhage area of wild-type ( WT ) and MMP-10-deficient ( Mmp10 −/− ) animals. (E) Representative immunofluorescence images showing neutrophils ( red ) and DAPI ( blue ) in the hemorrhage area ( white dots ) of WT and Mmp10 −/− mice. Scale = 200 µm. Magnification images of selected areas (*). Scale = 20 µm. Mean ± SD, * p < 0.05 vs. saline and ## p < 0.01 vs. WT using Kruskal–Wallis and Mann–Whitney U-test, n ≥ 4/group. ICH, intracranial hemorrhage; SD, standard deviation.
