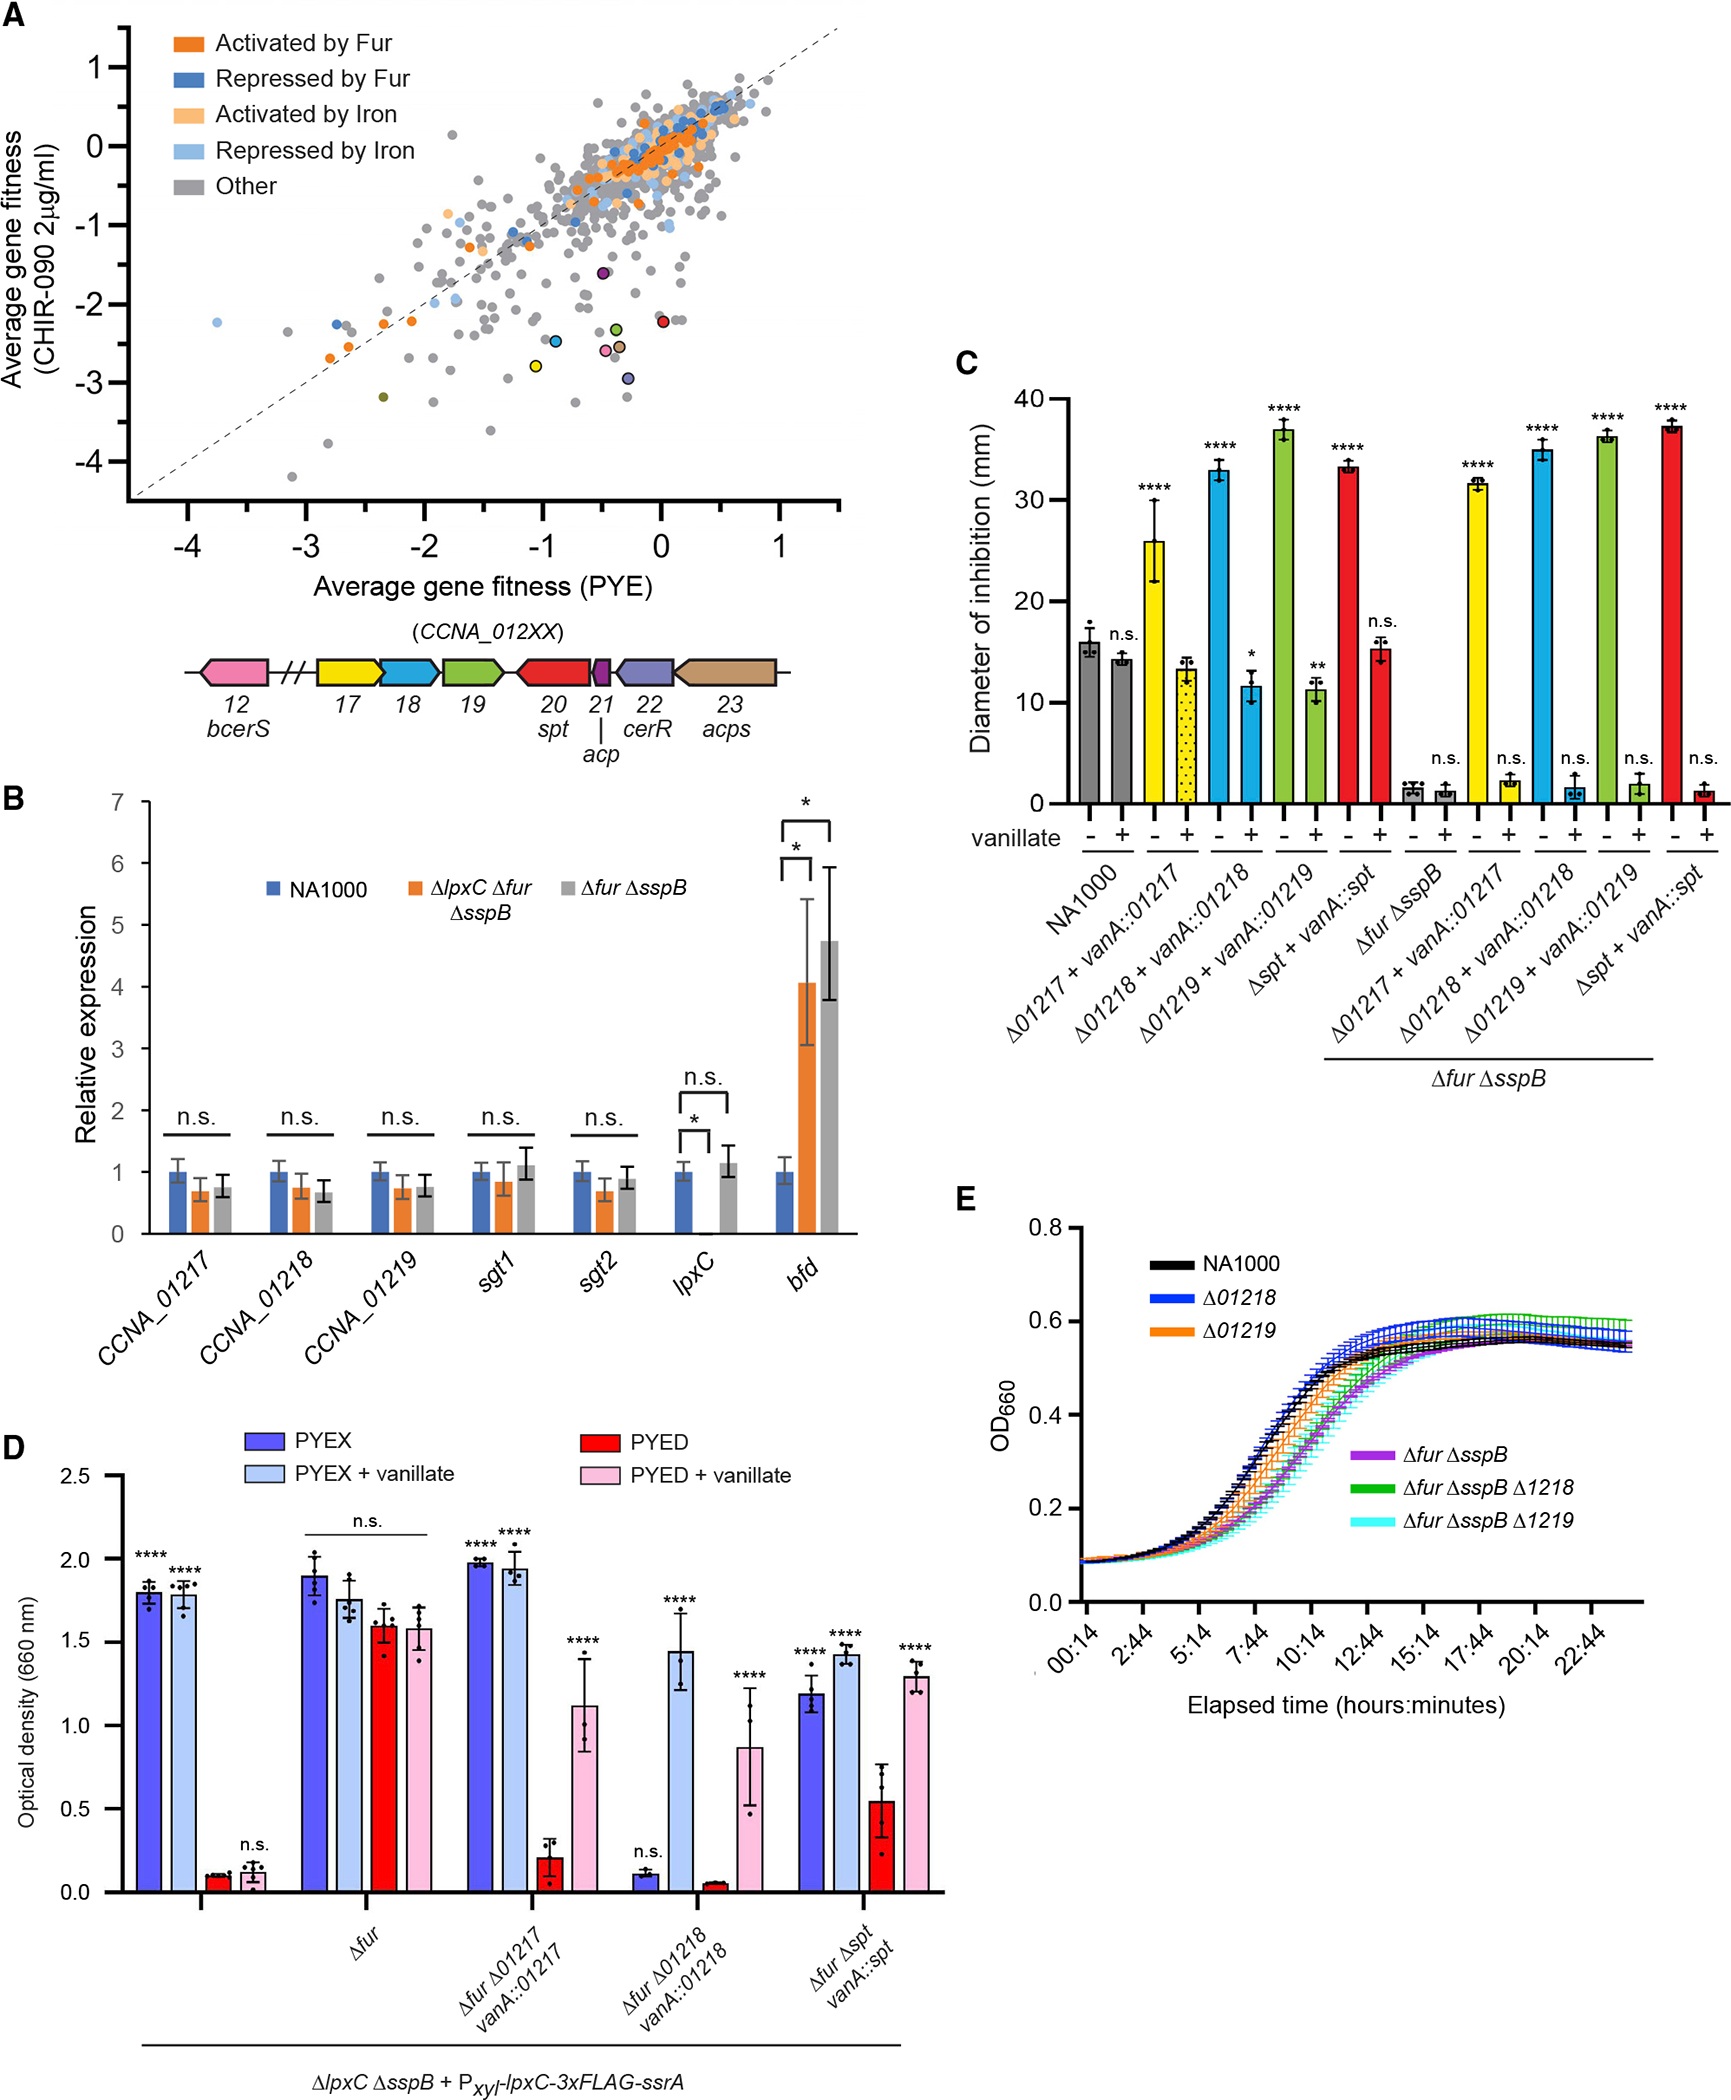
Figure 5. RB-TnSeq identifies sphingolipid synthesis genes needed for fitness when LpxC is inhibited.

(A) Average gene fitness scores for three challenges of the NA1000 RB-TnSeq library with PYE or PYE + 2 μg/mL CHIR-090. Fitness scores are color-coded based on regulation of the corresponding genes. The average fitness scores of genes selected for analysis are indicated by colors matching the open reading frame diagram below. See also Table S4.
(B) Wild-type, Δfur ΔsspB, and Δfur ΔlpxC ΔsspB cells were grown to mid-log phase in PYE, and expression of the indicated genes was measured by qRT-PCR (N = 3 biological replicates, mean ± S.D). Gene expression was normalized to the wild-type sample for each gene tested, and significance was tested by one-way ANOVA followed by Šídák’s multiple comparisons test, where each strain was compared with the wild type.
(C) CHIR-090 sensitivity was measured by disc diffusion assay (mean ± SD). Where indicated, 0.5 mM vanillate was included in the medium. Dots represent individual measurements, and significance was tested by one-way ANOVA followed by Šídák’s multiple comparisons test, where each condition was compared with NA1000 without vanillate or, for strains harboring Δfur ΔsspB, with Δfur ΔsspB without vanillate. The shaded bar indicates a ring of partial growth, and this condition was excluded from the analysis.
(D) Overnight growth of strains expressing (PYEX) or depleting (PYED) LpxC and expressing (vanillate) or not expressing the indicated genes (mean ± SD). Dots represent individual measurements, and significance was tested by one-way ANOVA followed by Šídák’s multiple comparisons test, where each condition was compared with growth of the same strain in PYED.
(E) Growth curves of the indicated strains in PYE medium (mean ± SD).
The following symbols apply to all significance tests: ****p < 0.0001; ***0.0001 < p < 0.001; **0.001 < p < 0.01; *0.01 < p < 0.05; n.s., not significant p > 0.05.
