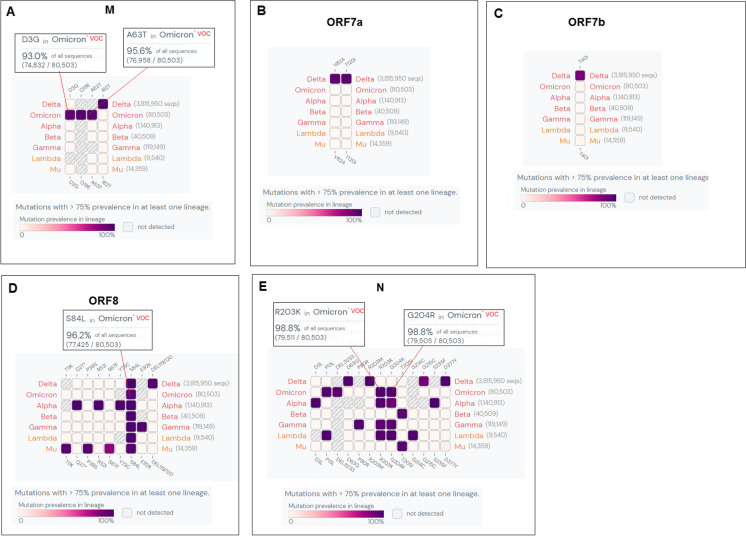
Fig. 10.
The heat map-like representation shows the high mutation prevalence (> 75% mutational frequency) of Omicron and other VOCs and VOIs in M, ORF7a, ORF7b, ORF8, N. (A) Heat map of M. (B) Heat map of ORF7a. (C) Heat map of ORF7b. (D) Heat map of ORF8. (E) Heat map of N. Here, we have also used outbreak.info [51] to provide the heat map-like representation of high mutation (AA mutation) prevalence (> 75% mutational frequency) of Omicron and other VOCs and VOIs. The server used GISAID API data and integrated the EpiData pipeline [65] from Johns Hopkins University if needed and finally represented through a graphical interface

