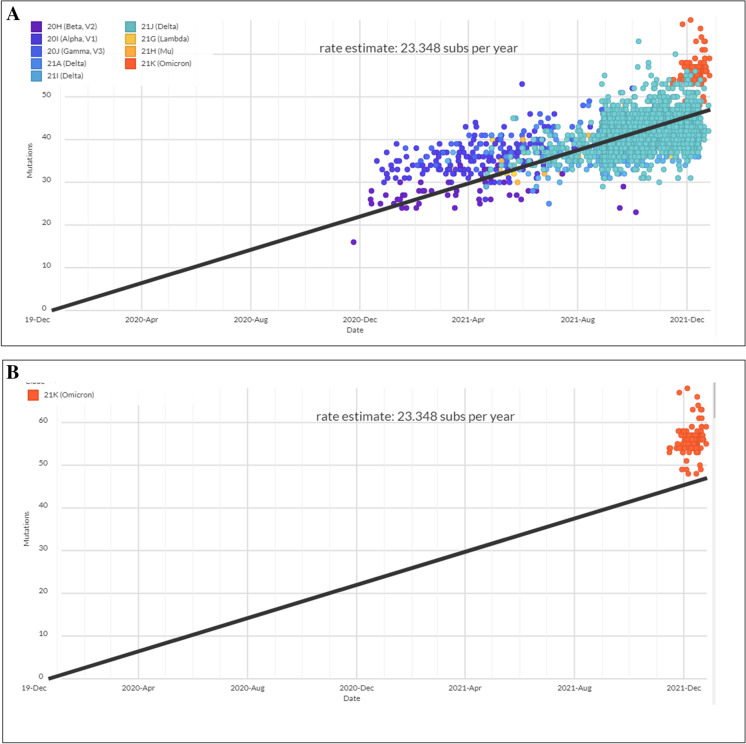
Fig. 11.
Scatter plot for cluster evaluation of Omicron and all VOCs and VOIs. (A) Scatter plot for cluster evaluation of all VOCs and VOIs. (B) Scatter plot for cluster evaluation of Omicron. The scatter plot was developed for Omicron and all VOCs and VOIs using the Nextstrain server [49, 50]. The server used the GISAID data

