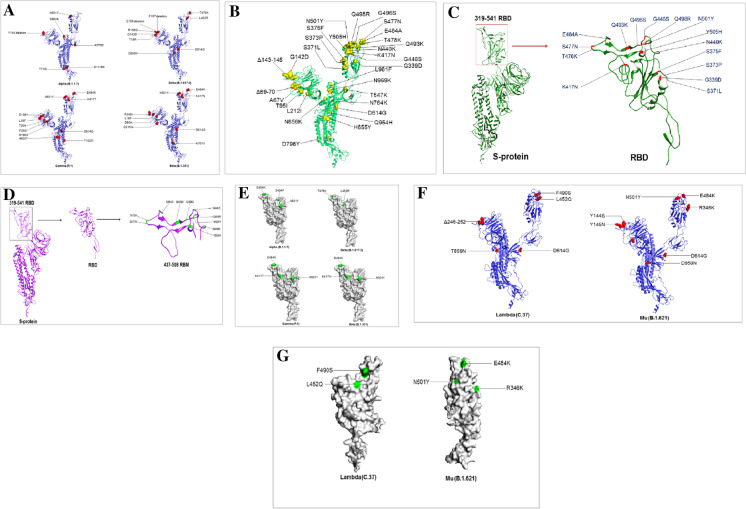
Fig. 4.
3D model illustrated the mutational landscape throughout the S-glycoprotein of Omicron and its comparison with VOCs and VOIs. (A) A 3D model that illustrates all the mutations of the S-glycoprotein of Omicron. (B) A 3D model that illustrates all the mutations RBD region of the S-glycoprotein of Omicron. (C) A 3D model describes all the mutations RBM of the S-glycoprotein of Omicron. (D) A 3D model that illustrates all the mutations in the VOCs (Delta (B.1.617.2), Alpha (B.1.1.7), Gamma (P.1), Beta (B.1.351)). (E) A 3D model that illustrates all the RBD mutations in the VOCs (Delta (B.1.617.2), Alpha (B.1.1.7), Gamma (P.1), Beta (B.1.351)). (F) A 3D model that illustrates all the mutations in the VOIs (Lambda (C.37) and Mu (B.1.621). (G) A3D model that illustrates all the RBD mutations in the VOIs (Lambda (C.37) and Mu (B.1.621)). All the 3D models were developed using PyMOL software. For a 3D model generation, we used some PDB files (PDB ID: 6VXX)

