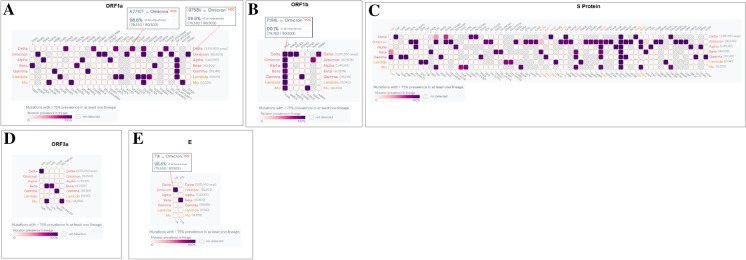
Fig. 9.
The heat map-like representation shows the high mutation prevalence (> 75% mutational frequency) of Omicron and other VOCs and VOIs in ORF1a, ORF1b, S-glycoprotein, ORF3a, E. (A) Heat map of ORF1a. (B) Heat map of ORF1b. (C) Heat map of S-glycoprotein. (D) Heat map of ORF3a. (E) Heat map of E. Here, we have used outbreak.info [51] to provide the heat map like representation of high mutation (AA mutation) prevalence (> 75% mutational frequency) of Omicron and other VOCs and VOIs of different parts of the genome. The server used GISAID API data and integrated the EpiData pipeline [65] from Johns Hopkins University if needed and finally represented through a graphical interface

