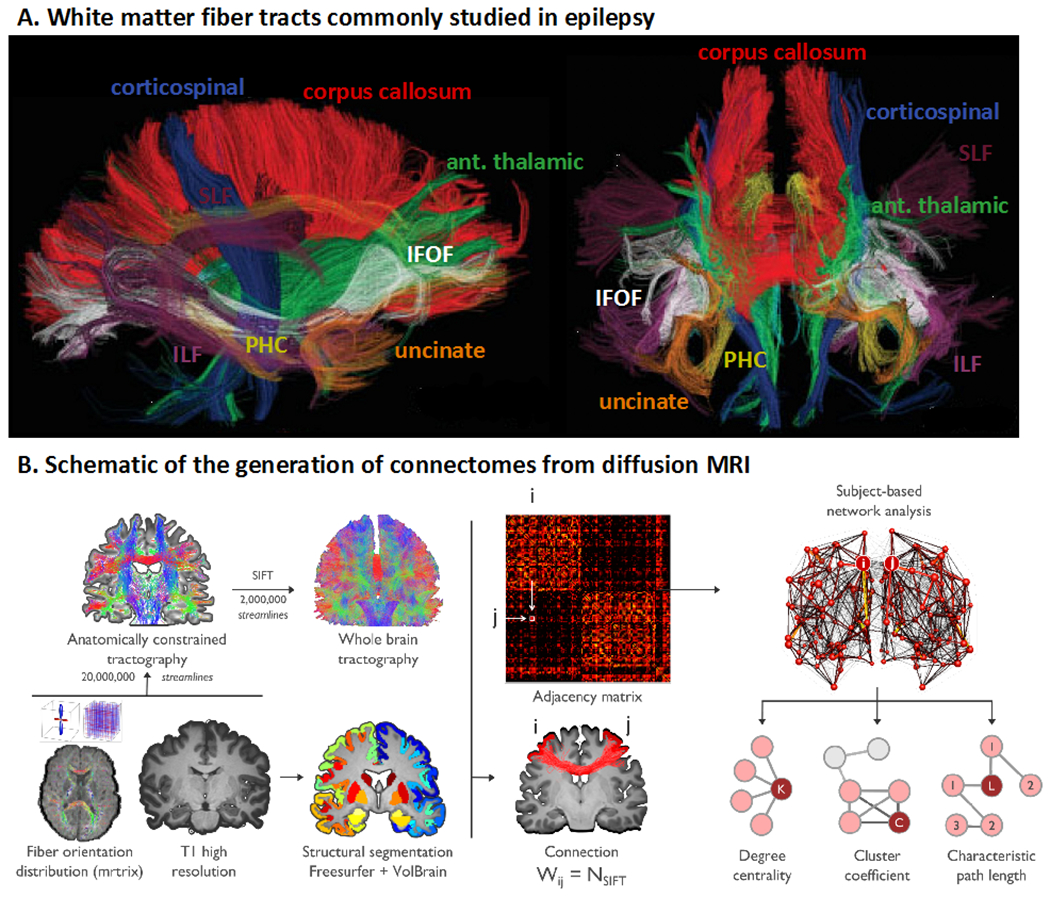
Figure 1. White matter tracts of interest and depiction of structural connectome.

(A) DTI-derived fiber tracts that are commonly studied in relation to clinical and cognitive outcomes in epilepsy. ILF = inferior longitudinal fasciculus; PHC = parahippocampal cingulum; IFOF = inferior fronto-occipital fasciculus; uncinate = uncinate fasciculus; ant. thalamic = anterior thalamic radiations. Adapted from Hagler et al., 2009, with permission. (B) Schematic showing the construction of a diffusion MRI connectome. Preprocessed dMRI data are analyzed in an automatically parcellated anatomical space. Adjacency (i.e., connectivity) matrices are then generated by systematically assessing pairwise associations between pairs of all regions (with regions i and j given as an example). Connectivity matrices are equivalent to brain graphs, where brain regions correspond to nodes and structural connections correspond to edges. Connection weight (Wij) is defined as the number of fiber tract connections between two nodes (i and j). The final step (top right) includes graph theory analysis based on the adjacency matrix to extract brain network topological organization (i.e., degree centrality, cluster coefficient, characteristic path length). Adapted from Rodríguez-Cruces et al., 2020, with permission.
