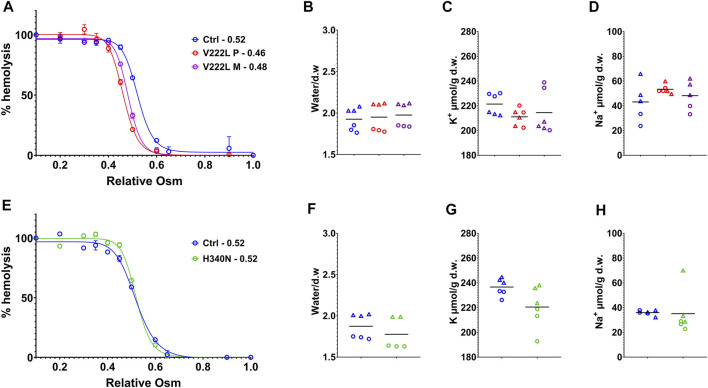
FIGURE 2.
Control vs. mutated RBC analysis. RBC analysis was made on patients and control blood collected at the same time and traveled together to the laboratory. (A,E): Osmotic resistance analysis made on total blood represented as percentage hemolysis function of relative NaCl concentration. Data are means ± SD illustrating one experiment done in triplicate on one blood shipment for each family. (A) Control in blue, V222L proband A in red and proband A’s mother in purple; (E) control in blue, H340N proband B in green. (B,C,D,F,G,H): RBC were washed in Ringer (1 mM Ca2+), dried, and weighted for water content expressed in g of water/g of dry weight (B,F), then solubilized for K+ (C,G) and Na+ (D,H) content measurements expressed in µmol/g of dry weight. Data showed the results coming from experiments performed on two blood shipments for each patient with corresponding controls (each experiment in triplicate, hence, six symbols of the same color per condition). Circles or triangles correspond to paired samples in the same shipment. From left to right along x axis in each plot: control (blue), proband A V222L (red), and proband A’s mother (purple) (B,C,D) and control (blue), proband B, and H340N (green) (F,G,H). The bars represent the median. Statistical analyses were made with a Mann–Whitney test when comparing two conditions or Kruskal–Wallis if more than two. Neither of both gave statistical differences for any conditions.

