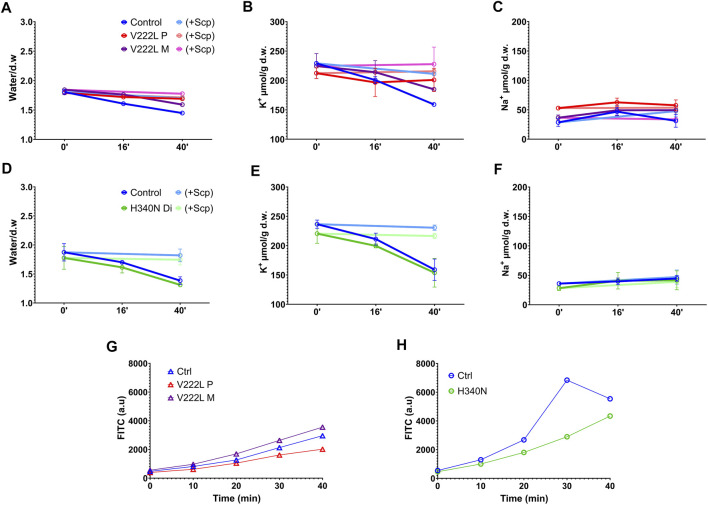
FIGURE 3.
RBC ion, water, and Ca2+ contents in response to vanadate. Washed RBCs were submitted to 5 mM Vanadate with or without 4 µM Senicapoc treatment in the presence of 0.5 mM ouabain. Water, K+, and Na+ contents were measured at different time points (0′, 16′ and 40′). Water content (A,D), K+ content (B,E), and Na+ content (C,F) are represented for control in blue, V222L proband A in red and proband A’s mother in purple: panel (A,B,C), and control in blue, H340N proband B in green: panel (D,E,F). Bright colors represented Senicapoc effect compared to untreated conditions. Data are given as mean ± SD of triplicate experiments done on either a single blood shipment for proband A [panel (A,B,C)] or two different blood shipments for proband B [panel (D,E,F)]. (G,H): Fresh RBCs were washed in Ringer without calcium and incubated with 5 µM Fluo-4AM 30min at 37°C. Fluo-4AM-loaded RBCs were then incubated in Ringer solution with 1 mM Ca2+ and 5 mM vanadate. Fluorescence was measured with a FACS as a function of time. Data are given as FITC in arbitrary units, median of a single experiment, 10,000 events. The fluorescence linked to basal intracellular Ca2+ concentration was in arbitrary units, mean ± s.e.m.: 750 ± 9 for proband A, 1,167 ± 6 for proband A’s mother, and 839 ± 6 for control and 528 ± 5 for proband B compared to 533 ± 7 for control.

